Mathematics in Independent Component Analysis
Mathematics in Independent Component Analysis
Mathematics in Independent Component Analysis

Create successful ePaper yourself
Turn your PDF publications into a flip-book with our unique Google optimized e-Paper software.
Chapter 11. EURASIP JASP, 2007 171<br />
10 EURASIP Journal on Advances <strong>in</strong> Signal Process<strong>in</strong>g<br />
Crosstalk<strong>in</strong>g error<br />
3.5<br />
3<br />
2.5<br />
2<br />
1.5<br />
1<br />
0.5<br />
0<br />
0 10 20 30 40 50 60 70 80 90 100<br />
Noise = 0%<br />
Percentage of outliers<br />
(a) Noiseless breakdown analysis with respect to outliers<br />
Crosstalk<strong>in</strong>g error<br />
3.5<br />
3<br />
2.5<br />
2<br />
1.5<br />
1<br />
0.5<br />
0<br />
0 10 20 30 40 50 60 70 80 90 100<br />
Noise = 0%<br />
Noise = 0.1%<br />
Percentage of outliers<br />
Noise = 0.5%<br />
Noise = 1%<br />
(b) Breakdown analysis for vary<strong>in</strong>g noise level<br />
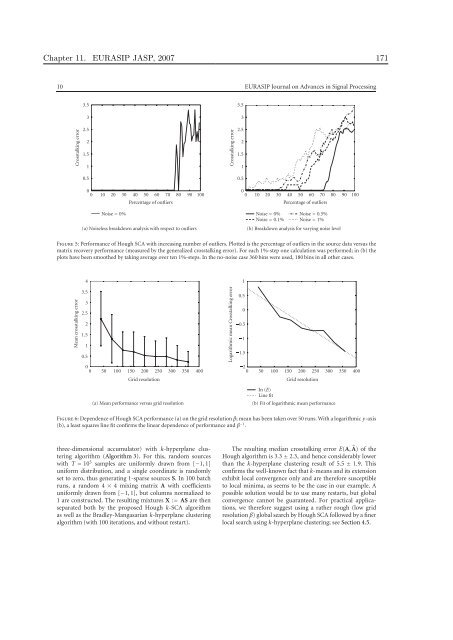
Figure 5: Performance of Hough SCA with <strong>in</strong>creas<strong>in</strong>g number of outliers. Plotted is the percentage of outliers <strong>in</strong> the source data versus the<br />
matrix recovery performance (measured by the generalized crosstalk<strong>in</strong>g error). For each 1%-step one calculation was performed; <strong>in</strong> (b) the<br />
plots have been smoothed by tak<strong>in</strong>g average over ten 1%-steps. In the no-noise case 360 b<strong>in</strong>s were used, 180 b<strong>in</strong>s <strong>in</strong> all other cases.<br />
Mean crosstalk<strong>in</strong>g error<br />
4<br />
3.5<br />
3<br />
2.5<br />
2<br />
1.5<br />
1<br />
0.5<br />
0<br />
0 50 100 150 200 250 300 350 400<br />
Grid resolution<br />
(a) Mean performance versus grid resolution<br />
Logarithmic mean Crosstalk<strong>in</strong>g error<br />
1<br />
0.5<br />
0<br />
0.5<br />
1<br />
1.5<br />
2<br />
0 50 100 150 200 250 300 350 400<br />
In (E)<br />
L<strong>in</strong>e fit<br />
Grid resolution<br />
(b) Fit of logarithmic mean performance<br />
Figure 6: Dependence of Hough SCA performance (a) on the grid resolution β; mean has been taken over 50 runs. With a logarithmic y-axis<br />
(b), a least squares l<strong>in</strong>e fit confirms the l<strong>in</strong>ear dependence of performance and β −1 .<br />
three-dimensional accumulator) with k-hyperplane cluster<strong>in</strong>g<br />
algorithm (Algorithm 3). For this, random sources<br />
with T = 10 5 samples are uniformly drawn from [−1, 1]<br />
uniform distribution, and a s<strong>in</strong>gle coord<strong>in</strong>ate is randomly<br />
set to zero, thus generat<strong>in</strong>g 1-sparse sources S. In 100 batch<br />
runs, a random 4 × 4 mix<strong>in</strong>g matrix A with coefficients<br />
uniformly drawn from [−1, 1], but columns normalized to<br />
1 are constructed. The result<strong>in</strong>g mixtures X := AS are then<br />
separated both by the proposed Hough k-SCA algorithm<br />
as well as the Bradley-Mangasarian k-hyperplane cluster<strong>in</strong>g<br />
algorithm (with 100 iterations, and without restart).<br />
The result<strong>in</strong>g median crosstalk<strong>in</strong>g error E(A, �A) of the<br />
Hough algorithm is 3.3 ± 2.3, and hence considerably lower<br />
than the k-hyperplane cluster<strong>in</strong>g result of 5.5 ± 1.9. This<br />
confirms the well-known fact that k-means and its extension<br />
exhibit local convergence only and are therefore susceptible<br />
to local m<strong>in</strong>ima, as seems to be the case <strong>in</strong> our example. A<br />
possible solution would be to use many restarts, but global<br />
convergence cannot be guaranteed. For practical applications,<br />
we therefore suggest us<strong>in</strong>g a rather rough (low grid<br />
resolution β) global search by Hough SCA followed by a f<strong>in</strong>er<br />
local search us<strong>in</strong>g k-hyperplane cluster<strong>in</strong>g; see Section 4.5.