- Page 1 and 2:
SECRÉTARIAT GÉNÉRAL DU COMITÉ I
- Page 3 and 4:
SommairePréface ..................
- Page 5 and 6: 4.3. - Les résultats obtenus par l
- Page 7: 7 - Les actions multilatérales ...
- Page 10 and 11: Parallèlement, et preuve que notre
- Page 12 and 13: S’agissant des visas Schengen, l
- Page 14 and 15: La baisse du nombre de titres attri
- Page 16 and 17: toire en bénéficiant d’une aide
- Page 18 and 19: Suède et devant le Royaume-Uni, le
- Page 20 and 21: 7 - Le développement solidaire (ch
- Page 22 and 23: ANNEXEExtension du système des vis
- Page 25 and 26: I-1La politiquede délivrance des v
- Page 27 and 28: Ainsi, le pourcentage des refus de
- Page 29 and 30: 1 - IntroductionLa définition de l
- Page 31 and 32: Le nombre de visas de circulation s
- Page 33 and 34: Tableau n o I1-7 : L’évolution d
- Page 35 and 36: Le fait marquant au premier semestr
- Page 37 and 38: À ce stade, le recueil des donnée
- Page 39 and 40: La CRRV peut soit recommander la d
- Page 41 and 42: I-2L’admission au séjour
- Page 43 and 44: Tableau n o I2-1 : Le regroupement
- Page 45 and 46: Graphique n o I2-3 : Nombre de titr
- Page 47 and 48: Tous motifs 2006 Familiaux 2006Étu
- Page 49 and 50: Tableaux n ° I2-5, I2-5 bis et I2-
- Page 51 and 52: 1 - L’immigration professionnelle
- Page 53 and 54: Tableau n o I2-6 : Répartition de
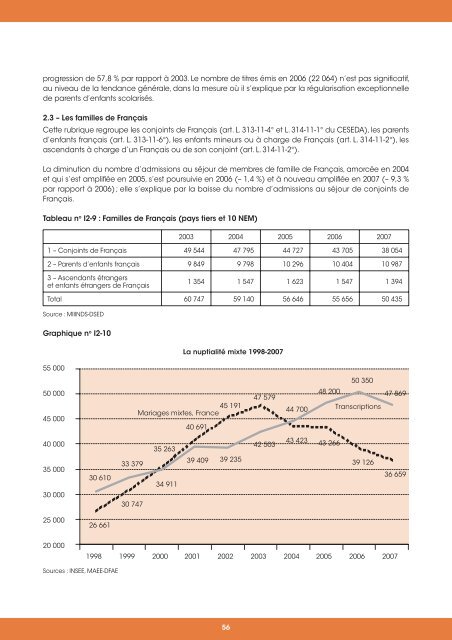
- Page 55: Analyse des écarts entre la déliv
- Page 59 and 60: Tableau n o I2-13 : Mariages de res
- Page 61 and 62: opposition du ministère public (le
- Page 63 and 64: 3.1.3 - Autres ressortissants étra
- Page 65 and 66: Tableau n o I2-15 : La délivrance
- Page 67 and 68: Tableau n o I2-16 bis : L’admissi
- Page 69 and 70: La carte de séjour temporaire vie
- Page 71 and 72: B4 - Les cartes de retraitéParmi l
- Page 73 and 74: B6 - Les titres communautaires et t
- Page 75 and 76: I-3L’immigrationirrégulière
- Page 77 and 78: d’autres facteurs tels que les fl
- Page 79 and 80: Cette direction, dont les compéten
- Page 81 and 82: À ce premier chiffre, il convient
- Page 83 and 84: du placement en zone d’attente en
- Page 85 and 86: Un expert PAF a également particip
- Page 87 and 88: Les filières d’immigration cland
- Page 89 and 90: Les illégaux irakiens et iraniens
- Page 91 and 92: Classement par nationalitéTableau
- Page 93 and 94: L’année 2006 avait été marqué
- Page 95 and 96: Il convient de noter que : la déci
- Page 97 and 98: Les droits à l’AME sont ouverts
- Page 99 and 100: Enfin, il est rappelé que ce type
- Page 101 and 102: La répartition par nationalité de
- Page 103 and 104: Tableau n o I3-25 : Taux de délivr
- Page 105 and 106: Centrede rétentionServicegestionna
- Page 107 and 108:
Les retours effectués dans le cadr
- Page 109 and 110:
Le décret n o 2007-801 du 11 mai 2
- Page 111 and 112:
3.4.1 - Le bilan de l’action des
- Page 113 and 114:
Fort des résultats enregistrés en
- Page 115 and 116:
4.1 - Une quantification toujours d
- Page 117 and 118:
Pour cet index, le nombre de person
- Page 119 and 120:
La part des saisines des préfectur
- Page 121 and 122:
Chapitre IIL’asile
- Page 123 and 124:
l’asile) ou par l’OFPRA (rejet
- Page 125 and 126:
L'activité de la Cour nationale du
- Page 127 and 128:
1.2 - La mise en œuvre des réform
- Page 129 and 130:
Pour l’année 2007, la part des P
- Page 131 and 132:
La demande d’asile dans les dépa
- Page 133 and 134:
Les continents les plus représent
- Page 135 and 136:
Les objectifs fixés par la loi de
- Page 137 and 138:
Région oudépartementCapacitéen C
- Page 139 and 140:
RégionsCapacitéagrééePlacesoccu
- Page 141 and 142:
Chapitre IIIL’intégrationet l’
- Page 143 and 144:
À la fin de la conférence les min
- Page 145 and 146:
Comment assurer la réussite éduca
- Page 147 and 148:
Dans le cadre du parcours d’inté
- Page 149 and 150:
cer la coopération et le partenari
- Page 151 and 152:
La collaboration de l’ensemble de
- Page 153 and 154:
Départements2003Juillet à 2004 20
- Page 155 and 156:
L’analyse de l’origine géograp
- Page 157 and 158:
le diplôme approfondi de langue fr
- Page 159 and 160:
2.3.1 - Un CAI pour la familleLa lo
- Page 161 and 162:
à l’emploi d’étrangers primoa
- Page 163 and 164:
4 - La promotion de la mémoire de
- Page 165 and 166:
Par ailleurs, le délai pendant leq
- Page 167 and 168:
5.2.2 - Nombre de décretsDécrets
- Page 169:
Sur la base de l’activité consta
- Page 172 and 173:
Présentation généraleLa problém
- Page 174 and 175:
Concernant l’aide apportée au d
- Page 176 and 177:
En ce sens, le programme “dévelo
- Page 178 and 179:
La politique de développement soli
- Page 180 and 181:
Le plus grand nombre (2/3) des port
- Page 182 and 183:
Graphique n o IV-7 : Répartition d
- Page 184 and 185:
70 % des projets sont réalisés da
- Page 186 and 187:
nelle en France ou au Mali. Ainsi,
- Page 188 and 189:
En France La cellule relais est cha
- Page 190 and 191:
L’ambassade d’Haïti a évoqué
- Page 192 and 193:
3 - L’aide à la réinsertionAu t
- Page 194 and 195:
Tableau n o IV-16 : Ventilation par
- Page 196 and 197:
des actions de formation profession
- Page 198 and 199:
7.1.2 - Les actions menées avec la
- Page 200 and 201:
dernières années au cours desquel
- Page 202 and 203:
Présentation généraleOutre-mer,
- Page 204 and 205:
À Wallis-et-Futuna, en Polynésie
- Page 206 and 207:
Le nombre d’étrangers en situati
- Page 208 and 209:
Le centre de rétention administrat
- Page 210 and 211:
la signature d’un accord de réad
- Page 212 and 213:
Après une forte augmentation du no
- Page 215:
Cinquième rapport au ParlementList
- Page 218 and 219:
Publication au JORF du 27 mai 2005D
- Page 220 and 221:
JO n o 134 du 10 juin 2005Texte n o
- Page 222 and 223:
Vu le décret du 17 mai 2007 portan
- Page 225:
Secrétariat généraldu Comité in
- Page 229 and 230:
229
- Page 231 and 232:
231
- Page 233:
233