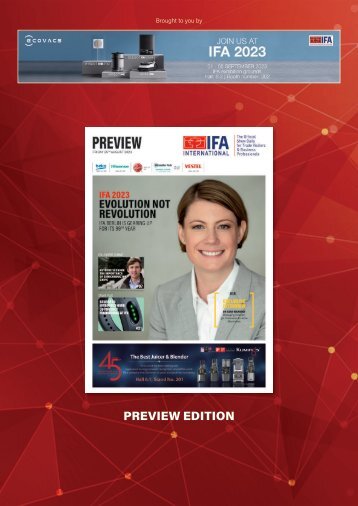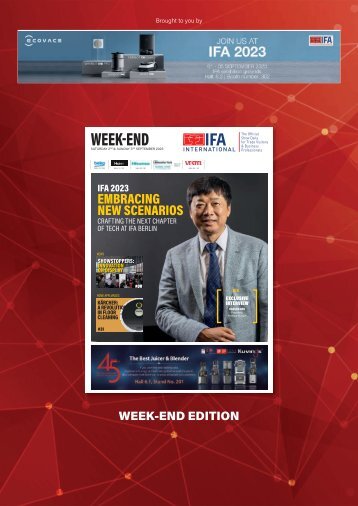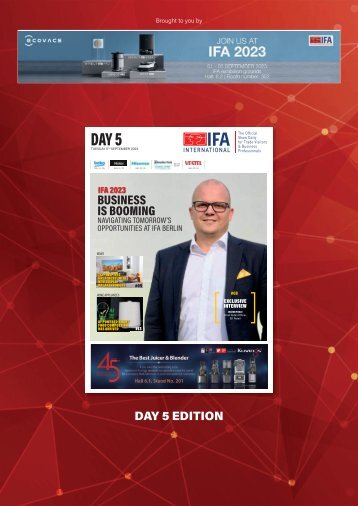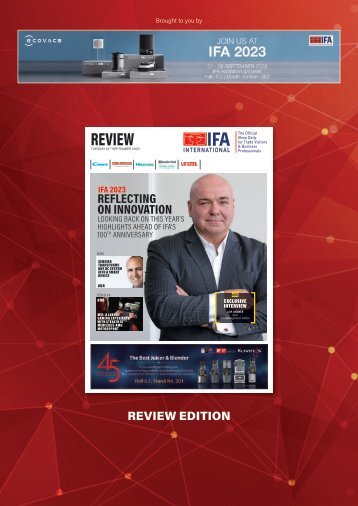
IFA iNternational 2019 DAY 4 Edition
- Text
- Audio
- Products
- Global
- Consumer
- Innovation
- Devices
- Awards
- September
- Wireless
- Electronics
- Www.cleverdis.com
50
REGION SPOTLIGHT ON CHINA GfK ON CHINA Current trends in technical consumer goods markets Chinese e-commerce growth is reaching a plateau, according to market analysts GfK. On a regional level, APAC and China are, of course, the world’s key markets for online sales. Historically Chinese e-commerce retailers have enjoyed significant double-digit growth, but in the past twelve months, growth rates have fallen. While the total online market for technical consumer goods in China grew by 8%, the major domestic appliances and consumer electronics sectors experienced their first negative rates in the online channel. Despite the share of e-commerce reaching another high of 36% of the turnover, slowing growth created a plateau effect. Chinese retailers have reacted with partnerships and mergers with traditional retailers. CHINA’S AUDIO MARKET DRIVES GLOBAL SALES Between January and June 2019, GfK recorded total sales of €7.9bn for the global audio devices market, excluding North America. Largest contributors are the CIS countries with a 41% increase, and China - up 38%. In-ear headphones saw a steady sales value growth of 55% in the first half of this year, accounting for sales volume of nearly €3bn for 70% of the total headphone turnover. China is by far the largest market, followed by the Western European and Developed Asian countries. PC MARKET BUOYED BY CHINESE SALES The demand for mobile PCs declined by 5% in units in the first half year of 2019. Only the Chinese market managed to grow (+2% in unit terms), while Western Europe and APAC (excluding China) declined by 6% in unit sales. However, due to the importance of performance and lifestyle/premium for the consumers, reflected in higher price points, the market for notebooks increased by 1% to reach nearly €18bn. China’s increase of 7% contributed the most to that growth, while Western Europe fell by 1%. MDA SALES WEAK IN CHINA Looking at the regions, in the first half of 2019, the MDA market experienced a recovery in Brazil (+13%) and a strong uptake in India (+10%). Europe remained on a growth track contributing to the biggest part of absolute Euro growth. However, a 6.2% decline in China was a major reason for the overall market slowdown. As China is such a large market, the other regions have struggled to offset its declines in market value. Therefore, looking at full year results in 2019, it is clear that market performance will depend on the fluctuating Chinese market and its trade tensions with the US. A more recent and substantial trend is steam-supported appliances which generate multiple use cases, from improved drying in dishwashers to fewer creases in laundry, to healthier cooking. Globally, steam-assisted products jumped to a growth rate of 41% in the first half of 2019. Currently China and India are embracing this trend, which promises future growth. Smart appliances are usually equated with the benefit of simplification. All regions reveal strong growth in sales of smart appliances, with the one exception – China. Looking at the global picture excluding China, smart appliances grew by 18% in turnover. THE TV MARKET Looking at the first half of 2019 on a regional level, China, with total sales of close to €8.5bn is the largest market, closely followed by Western Europe. However, sales in China, the former global growth engine, declined by 12% yearon-year in the first half. The ratio between online and offline sales in China in the first half of 2019 was at almost 50/50 490 480 470 460 450 440 430 420 410 400 390 380 372.19 370 360 350 340 330 330.78 372.19 364.66 344.98 377.69 352.62 378.48 Turnover Development for Technical Consumer Goods China Q2 2019 - CNY bn 378.48 405.41 400.56 436.92 397.23 446.10 437.63 481.16 446.86 382.60 393.16 453.10 402.87 403.09 385.74 428.98 389.72 408.63 KEY FIGURES €7.9bn for the global audio devices market, excluding North America 55% In-ear headphones saw a steady sales value growth of 55% 320 Q1 2013 Q2 2013 Q2 2013 Q4 2013 Q1 2014 Q2 2014 Q2 2014 Q4 2014 Q1 2015 Q2 2015 Q2 2015 Q4 2015 Q1 2016 Q2 2016 Q2 2016 Q4 2016 Q1 2017 Q2 2017 Q2 2017 Q4 2017 Q1 2018 Q2 2018 Q2 2018 Q4 2018 Q1 2019 Q2 2019 Source GfK www.ifa-international.org IFA International • Monday 9 September 2019 51
- Page 1: DAY 4 EDITION Monday 9 September 20
- Page 5 and 6: BROUGHT TO YOU BY NEWS QUALCOMM TEC
- Page 7 and 8: BROUGHT TO YOU BY NEWS MEDISANA DEB
- Page 9 and 10: BROUGHT TO YOU BY NEWS Taiwan Excel
- Page 11 and 12: BROUGHT TO YOU BY NEWS Named as the
- Page 13 and 14: AWARDS @ IFA NEWS ADVERTORIAL IFA A
- Page 15 and 16: AWARDS @ IFA NEWS ADVERTORIAL TCL:
- Page 17 and 18: AWARDS @ IFA NEWS ADVERTORIAL AFTER
- Page 19 and 20: AWARDS @ IFA NEWS ADVERTORIAL MARRY
- Page 21 and 22: ASKING THE RIGHT QUESTIONS TO PREPA
- Page 23 and 24: IFA NEXT: The Edge Of Innovation TH
- Page 25 and 26: IFA GLOBAL MARKETS GROWS ITS SOURCI
- Page 27: EXCLUSIVE INTERVIEW STREAMING IS A
- Page 30 and 31: EXCLUSIVE INTERVIEW SENNHEISER HERA
- Page 33 and 34: LIVING ROOM LIFESTYLE IFA My Media
- Page 35 and 36: LIVING ROOM LIFESTYLE SMART HOME BR
- Page 37 and 38: LIVING ROOM LIFESTYLE SMART HOME PR
- Page 39: LIVING ROOM LIFESTYLE HOME NETWORKS
- Page 43: LIVING ROOM LIFESTYLE TVs PRODUCT S
- Page 47 and 48: BUYERS' GUIDE LIVING ROOM LIFESTYLE
- Page 49: REGION SPOTLIGHT ON CHINA IN 2018,
- Page 53 and 54: © Thomas Keller HOSPITALITY / REST
Inappropriate
Loading...
Mail this publication
Loading...
Embed
Loading...

IFA International
- IFA International 2023
- IFA International 2022
- IFA International 2020
- IFA International 2019
- IFA International 2018
- IFA International 2017
- IFA International 2016
- IFA International 2015
- IFA International 2014
- IFA International 2013
- IFA International 2012
- IFA International 2011
- IFA International 2010
- IFA International 2009
- IFA International 2008
- IFA International 2007
