- Page 2 and 3:
About the Partners CIAT The Interna
- Page 4 and 5:
Centro Internacional de Agricultura
- Page 6 and 7:
Chapter 4 Whiteflies and Whitefly-b
- Page 8 and 9:
Chapter 6 Whiteflies and Whitefly-b
- Page 10 and 11:
Contents Page Foreword vii Introduc
- Page 12 and 13:
Contents Chapter SECTION THREE Whit
- Page 14 and 15:
Foreword This book is the product o
- Page 16 and 17:
Introduction Introduction The Probl
- Page 18 and 19:
Introduction In addition to the yie
- Page 20 and 21:
Introduction in pesticide use in La
- Page 22 and 23:
Introduction annual crops, especial
- Page 24 and 25:
Introduction Plant Resistance contr
- Page 26 and 27:
Introduction Otim-Nape, G. W.; Bua,
- Page 28 and 29: SECTION ONE Whiteflies as Vectors o
- Page 30 and 31: Introduction CHAPTER 1.1 Introducti
- Page 32 and 33: Introduction diseases than is cassa
- Page 34 and 35: Introduction Sub-project on Whitefl
- Page 36 and 37: Introduction References Aritua, V.;
- Page 38 and 39: Introduction Thresh, J. M.; Otim-Na
- Page 40 and 41: Ghana 1997, on 80 farms. These incl
- Page 42 and 43: Ghana (6.2%), Bakentenma (5%) and K
- Page 44 and 45: Ghana Legg, J. P.; James, B. D. 199
- Page 46 and 47: Benin Northern guinea savannah Sout
- Page 48 and 49: Benin or disease problem, the main
- Page 50 and 51: Nigeria CHAPTER 1.4 Nigeria Introdu
- Page 52 and 53: Nigeria TMS 30572 (18.8%) and TMS 3
- Page 54 and 55: Nigeria FAO (Food and Agriculture O
- Page 56 and 57: Cameroon protocol, to enable valid
- Page 58 and 59: Cameroon Farmers undertook various
- Page 60 and 61: Cameroon Robertson, I. A. D. 1987.
- Page 62 and 63: Uganda between November 1997 and Ja
- Page 64 and 65: Uganda environment, host plant heal
- Page 66 and 67: Uganda local varieties. Assessments
- Page 68 and 69: Uganda Harrison, B. D. 1987. Proper
- Page 70 and 71: Kenya Recent epidemiological studie
- Page 72 and 73: Kenya respective diseases were reco
- Page 74 and 75: Kenya Bock, K. R. 1983. Epidemiolog
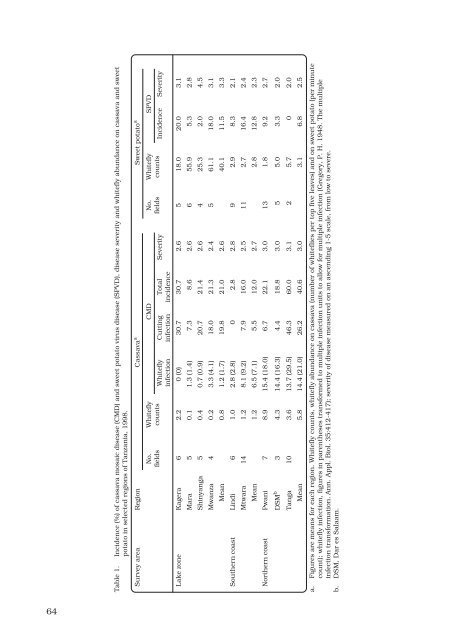
- Page 76 and 77: Tanzania CHAPTER 1.8 Tanzania Intro
- Page 80 and 81: Tanzania loss) to assess yield loss
- Page 82 and 83: Tanzania Legg, J. P.; Raya, M. 1998
- Page 84 and 85: Malawi Increased Biological Underst
- Page 86 and 87: Malawi Physiology and Ecology in th
- Page 88 and 89: Madagascar Tanzania Madagascar Moza
- Page 90 and 91: Madagascar surprising, particularly
- Page 92 and 93: Diversity of African Cassava Mosaic
- Page 94 and 95: Diversity of African Cassava Mosaic
- Page 96 and 97: Diversity of African Cassava Mosaic
- Page 98 and 99: Sweetpotato Virus Disease in East A
- Page 100 and 101: Sweetpotato Virus Disease in East A
- Page 102 and 103: Sweetpotato Virus Disease in East A
- Page 104 and 105: Factors Associated with Damage CHAP
- Page 106 and 107: Factors Associated with Damage Mean
- Page 108 and 109: Factors Associated with Damage % SP
- Page 110 and 111: Factors Associated with Damage thro
- Page 112 and 113: Factors Associated with Damage Gedd
- Page 114 and 115: Conclusions and Recommendations col
- Page 116 and 117: Conclusions and Recommendations Mal
- Page 118 and 119: Conclusions and Recommendations Mpi
- Page 120 and 121: Conclusions and Recommendations com
- Page 122 and 123: Conclusions and Recommendations con
- Page 124 and 125: Conclusions and Recommendations (2)
- Page 126 and 127: Conclusions and Recommendations Ger
- Page 128 and 129:
SECTION TWO Whiteflies as Pests and
- Page 130 and 131:
Introduction CHAPTER 2.1 Introducti
- Page 132 and 133:
Introduction Czosnek, H.; Navot, N.
- Page 134 and 135:
Sudan cotton, leading to the introd
- Page 136 and 137:
Sudan Table 1. Reproductive host pl
- Page 138 and 139:
Sudan Historically, Sudan has been
- Page 140 and 141:
Sudan Only 10% of producers reporte
- Page 142 and 143:
Sudan Conclusions The work conducte
- Page 144 and 145:
Kenya CHAPTER 2.3 Kenya Introductio
- Page 146 and 147:
Kenya Increased Biological Understa
- Page 148 and 149:
Kenya Samples of 10 plants per fiel
- Page 150 and 151:
Kenya Table 4. Maximum incidence (%
- Page 152 and 153:
Kenya Seventy-nine percent of tomat
- Page 154 and 155:
Kenya under Phase 2 of the TWF-IPM
- Page 156 and 157:
Tanzania CHAPTER 2.4 Tanzania Intro
- Page 158 and 159:
Tanzania The reproductive host plan
- Page 160 and 161:
Tanzania Geographical range of whit
- Page 162 and 163:
Tanzania Local names given to white
- Page 164 and 165:
Tanzania Nono-Womdim, R.; Swai, I.
- Page 166 and 167:
Malawi levels of infestation by the
- Page 168 and 169:
Malawi Table 3. Maximum incidence (
- Page 170 and 171:
Malawi (40%) believe that the white
- Page 172 and 173:
Tomato Yellow Leaf Curl Virus in E.
- Page 174 and 175:
Tomato Yellow Leaf Curl Virus in E.
- Page 176 and 177:
Tomato Yellow Leaf Curl Virus in E.
- Page 178 and 179:
Conclusions and Recommendations CHA
- Page 180 and 181:
Conclusions and Recommendations (Fi
- Page 182 and 183:
Conclusions and Recommendations Cen
- Page 184 and 185:
Conclusions and Recommendations the
- Page 186 and 187:
SECTION THREE Whiteflies as Vectors
- Page 188 and 189:
Introduction CHAPTER 3.1 Introducti
- Page 190 and 191:
Introduction especially for export.
- Page 192 and 193:
Mexico CHAPTER 3.2 Mexico Introduct
- Page 194 and 195:
Mexico Culiacán, Sinaloa, in north
- Page 196 and 197:
Mexico Table 2. Virus survey of tom
- Page 198 and 199:
Mexico results of the molecular bio
- Page 200 and 201:
Mexico Strengthened Research Capaci
- Page 202 and 203:
Mexico López, R. 1996. Experiencia
- Page 204 and 205:
Guatemala 1960s, and at this time t
- Page 206 and 207:
Guatemala Table 2. Results of white
- Page 208 and 209:
Guatemala Table 5. Cropping systems
- Page 210 and 211:
Guatemala contemplated in this prel
- Page 212 and 213:
El Salvador CHAPTER 3.4 El Salvador
- Page 214 and 215:
El Salvador During the course of th
- Page 216 and 217:
El Salvador markets: common bean, m
- Page 218 and 219:
El Salvador Current Status of White
- Page 220 and 221:
Honduras Copan Ocotepeque Santa Bá
- Page 222 and 223:
Honduras Table 3. Biotyping of whit
- Page 224 and 225:
Honduras References Caballero, R. 1
- Page 226 and 227:
Nicaragua Nueva Segovia Madriz Este
- Page 228 and 229:
Nicaragua Lowlands of Nicaragua. Th
- Page 230 and 231:
Nicaragua Region VI is a main horti
- Page 232 and 233:
Costa Rica CHAPTER 3.7 Costa Rica I
- Page 234 and 235:
Costa Rica Table 1. Characterizatio
- Page 236 and 237:
Costa Rica Castillo, J. 1997. Movim
- Page 238 and 239:
Panama Bocas del Toro Chiriquí Ver
- Page 240 and 241:
Panama Gámez, R. 1970. Los virus d
- Page 242 and 243:
Haiti Grande-Anse Sud Grande-Anse S
- Page 244 and 245:
Haiti collaborators in this project
- Page 246 and 247:
Cuba Ciudad de la Habana Pinar del
- Page 248 and 249:
Cuba Table 3. Comparative homologie
- Page 250 and 251:
Cuba project provided three keynote
- Page 252 and 253:
Dominican Republic CHAPTER 3.11 Dom
- Page 254 and 255:
Dominican Republic monoclonal antib
- Page 256 and 257:
Dominican Republic Strengthened Res
- Page 258 and 259:
Reproductive Crop Hosts of Bemisia
- Page 260 and 261:
Reproductive Crop Hosts of Bemisia
- Page 262 and 263:
Reproductive Crop Hosts of Bemisia
- Page 264 and 265:
Reproductive Crop Hosts of Bemisia
- Page 266 and 267:
Biotypes of Bemisia tabaci CHAPTER
- Page 268 and 269:
Biotypes of Bemisia tabaci For this
- Page 270 and 271:
Biotypes of Bemisia tabaci 100 99 B
- Page 272 and 273:
Biotypes of Bemisia tabaci biotype
- Page 274 and 275:
Biotypes of Bemisia tabaci Table 2.
- Page 276 and 277:
Biotypes of Bemisia tabaci Already
- Page 278 and 279:
Conclusions and Recommendations CHA
- Page 280 and 281:
Conclusions and Recommendations gre
- Page 282 and 283:
SECTION FOUR Whiteflies as Pests of
- Page 284 and 285:
Introduction CHAPTER 4.1 Introducti
- Page 286 and 287:
Introduction control, due to resist
- Page 288 and 289:
Introduction Posada, L. 1976. Lista
- Page 290 and 291:
Colombia and Ecuador B biotype B. t
- Page 292 and 293:
Colombia and Ecuador assistants and
- Page 294 and 295:
Colombia and Ecuador and squash. On
- Page 296 and 297:
Colombia and Ecuador Table 2. Main
- Page 298 and 299:
Colombia and Ecuador Table 6. Patte
- Page 300 and 301:
Insecticide Resistance in Colombia
- Page 302 and 303:
Insecticide Resistance in Colombia
- Page 304 and 305:
Insecticide Resistance in Colombia
- Page 306 and 307:
Insecticide Resistance in Colombia
- Page 308 and 309:
Insecticide Resistance in Colombia
- Page 310 and 311:
Conclusions and Recommendations CHA
- Page 312 and 313:
Conclusions and Recommendations res
- Page 314 and 315:
Conclusions and Recommendations rot
- Page 316 and 317:
SECTION FIVE Special Topics on Pest
- Page 318 and 319:
Sustainable IPM through Host Plant
- Page 320 and 321:
Sustainable IPM through Host Plant
- Page 322 and 323:
Sustainable IPM through Host Plant
- Page 324 and 325:
Sustainable IPM through Host Plant
- Page 326 and 327:
Sustainable IPM through Host Plant
- Page 328 and 329:
Biological Control of Whiteflies by
- Page 330 and 331:
Biological Control of Whiteflies by
- Page 332 and 333:
Biological Control of Whiteflies by
- Page 334 and 335:
Biological Control of Whiteflies by
- Page 336 and 337:
Biological Control of Whiteflies by
- Page 338 and 339:
Biological Control of Whiteflies by
- Page 340 and 341:
Progress of Cassava Mosaic Disease
- Page 342 and 343:
Progress of Cassava Mosaic Disease
- Page 344 and 345:
Progress of Cassava Mosaic Disease
- Page 346 and 347:
Progress of Cassava Mosaic Disease
- Page 348 and 349:
Management of the Cassava Mosaic Di
- Page 350 and 351:
Management of the Cassava Mosaic Di
- Page 352 and 353:
Management of the Cassava Mosaic Di
- Page 354 and 355:
Conclusions Conclusions The Tropica
- Page 356 and 357:
Conclusions whitefly pests and thus
- Page 358 and 359:
Conclusions developing countries, a
- Page 360 and 361:
Acronyms and Abbreviations Acronyms
- Page 362 and 363:
Acronyms and Abbreviations FIRA Fid
- Page 364 and 365:
Acronyms and Abbreviations PROFRIJO
- Page 366:
Acronyms and Abbreviations PYR pyre