Intrusion Defense Firewall 1.2 User's Guide - Trend Micro? Online ...
Intrusion Defense Firewall 1.2 User's Guide - Trend Micro? Online ...
Intrusion Defense Firewall 1.2 User's Guide - Trend Micro? Online ...
You also want an ePaper? Increase the reach of your titles
YUMPU automatically turns print PDFs into web optimized ePapers that Google loves.
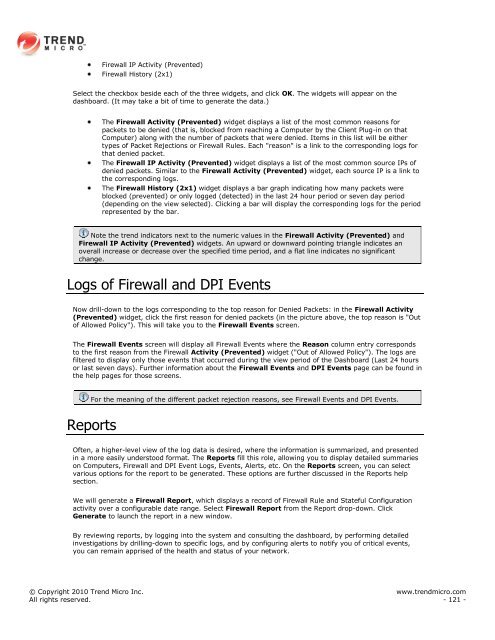
<strong>Firewall</strong> IP Activity (Prevented)<br />
<strong>Firewall</strong> History (2x1)<br />
Select the checkbox beside each of the three widgets, and click OK. The widgets will appear on the<br />
dashboard. (It may take a bit of time to generate the data.)<br />
The <strong>Firewall</strong> Activity (Prevented) widget displays a list of the most common reasons for<br />
packets to be denied (that is, blocked from reaching a Computer by the Client Plug-in on that<br />
Computer) along with the number of packets that were denied. Items in this list will be either<br />
types of Packet Rejections or <strong>Firewall</strong> Rules. Each "reason" is a link to the corresponding logs for<br />
that denied packet.<br />
The <strong>Firewall</strong> IP Activity (Prevented) widget displays a list of the most common source IPs of<br />
denied packets. Similar to the <strong>Firewall</strong> Activity (Prevented) widget, each source IP is a link to<br />
the corresponding logs.<br />
The <strong>Firewall</strong> History (2x1) widget displays a bar graph indicating how many packets were<br />
blocked (prevented) or only logged (detected) in the last 24 hour period or seven day period<br />
(depending on the view selected). Clicking a bar will display the corresponding logs for the period<br />
represented by the bar.<br />
Note the trend indicators next to the numeric values in the <strong>Firewall</strong> Activity (Prevented) and<br />
<strong>Firewall</strong> IP Activity (Prevented) widgets. An upward or downward pointing triangle indicates an<br />
overall increase or decrease over the specified time period, and a flat line indicates no significant<br />
change.<br />
Logs of <strong>Firewall</strong> and DPI Events<br />
Now drill-down to the logs corresponding to the top reason for Denied Packets: in the <strong>Firewall</strong> Activity<br />
(Prevented) widget, click the first reason for denied packets (in the picture above, the top reason is "Out<br />
of Allowed Policy"). This will take you to the <strong>Firewall</strong> Events screen.<br />
The <strong>Firewall</strong> Events screen will display all <strong>Firewall</strong> Events where the Reason column entry corresponds<br />
to the first reason from the <strong>Firewall</strong> Activity (Prevented) widget ("Out of Allowed Policy"). The logs are<br />
filtered to display only those events that occurred during the view period of the Dashboard (Last 24 hours<br />
or last seven days). Further information about the <strong>Firewall</strong> Events and DPI Events page can be found in<br />
the help pages for those screens.<br />
For the meaning of the different packet rejection reasons, see <strong>Firewall</strong> Events and DPI Events.<br />
Reports<br />
Often, a higher-level view of the log data is desired, where the information is summarized, and presented<br />
in a more easily understood format. The Reports fill this role, allowing you to display detailed summaries<br />
on Computers, <strong>Firewall</strong> and DPI Event Logs, Events, Alerts, etc. On the Reports screen, you can select<br />
various options for the report to be generated. These options are further discussed in the Reports help<br />
section.<br />
We will generate a <strong>Firewall</strong> Report, which displays a record of <strong>Firewall</strong> Rule and Stateful Configuration<br />
activity over a configurable date range. Select <strong>Firewall</strong> Report from the Report drop-down. Click<br />
Generate to launch the report in a new window.<br />
By reviewing reports, by logging into the system and consulting the dashboard, by performing detailed<br />
investigations by drilling-down to specific logs, and by configuring alerts to notify you of critical events,<br />
you can remain apprised of the health and status of your network.<br />
© Copyright 2010 <strong>Trend</strong> <strong>Micro</strong> Inc. www.trendmicro.com<br />
All rights reserved. - 121 -


