Intrusion Defense Firewall 1.2 User's Guide - Trend Micro? Online ...
Intrusion Defense Firewall 1.2 User's Guide - Trend Micro? Online ...
Intrusion Defense Firewall 1.2 User's Guide - Trend Micro? Online ...

You also want an ePaper? Increase the reach of your titles
YUMPU automatically turns print PDFs into web optimized ePapers that Google loves.
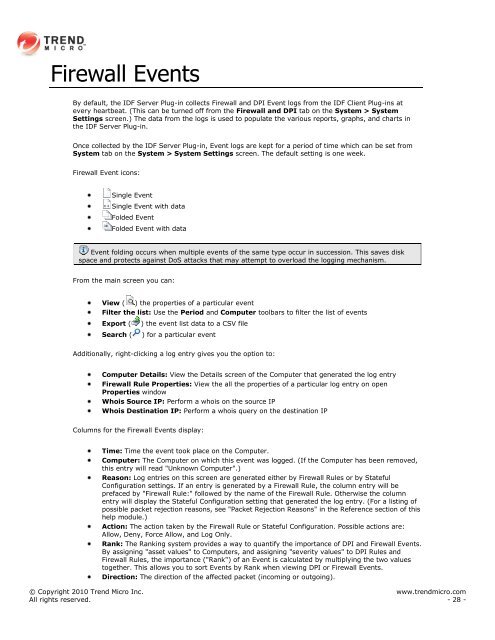
<strong>Firewall</strong> Events<br />
By default, the IDF Server Plug-in collects <strong>Firewall</strong> and DPI Event logs from the IDF Client Plug-ins at<br />
every heartbeat. (This can be turned off from the <strong>Firewall</strong> and DPI tab on the System > System<br />
Settings screen.) The data from the logs is used to populate the various reports, graphs, and charts in<br />
the IDF Server Plug-in.<br />
Once collected by the IDF Server Plug-in, Event logs are kept for a period of time which can be set from<br />
System tab on the System > System Settings screen. The default setting is one week.<br />
<strong>Firewall</strong> Event icons:<br />
Single Event<br />
Single Event with data<br />
Folded Event<br />
Folded Event with data<br />
Event folding occurs when multiple events of the same type occur in succession. This saves disk<br />
space and protects against DoS attacks that may attempt to overload the logging mechanism.<br />
From the main screen you can:<br />
View ( ) the properties of a particular event<br />
Filter the list: Use the Period and Computer toolbars to filter the list of events<br />
Export ( ) the event list data to a CSV file<br />
Search ( ) for a particular event<br />
Additionally, right-clicking a log entry gives you the option to:<br />
Computer Details: View the Details screen of the Computer that generated the log entry<br />
<strong>Firewall</strong> Rule Properties: View the all the properties of a particular log entry on open<br />
Properties window<br />
Whois Source IP: Perform a whois on the source IP<br />
Whois Destination IP: Perform a whois query on the destination IP<br />
Columns for the <strong>Firewall</strong> Events display:<br />
Time: Time the event took place on the Computer.<br />
Computer: The Computer on which this event was logged. (If the Computer has been removed,<br />
this entry will read "Unknown Computer".)<br />
Reason: Log entries on this screen are generated either by <strong>Firewall</strong> Rules or by Stateful<br />
Configuration settings. If an entry is generated by a <strong>Firewall</strong> Rule, the column entry will be<br />
prefaced by "<strong>Firewall</strong> Rule:" followed by the name of the <strong>Firewall</strong> Rule. Otherwise the column<br />
entry will display the Stateful Configuration setting that generated the log entry. (For a listing of<br />
possible packet rejection reasons, see "Packet Rejection Reasons" in the Reference section of this<br />
help module.)<br />
Action: The action taken by the <strong>Firewall</strong> Rule or Stateful Configuration. Possible actions are:<br />
Allow, Deny, Force Allow, and Log Only.<br />
Rank: The Ranking system provides a way to quantify the importance of DPI and <strong>Firewall</strong> Events.<br />
By assigning "asset values" to Computers, and assigning "severity values" to DPI Rules and<br />
<strong>Firewall</strong> Rules, the importance ("Rank") of an Event is calculated by multiplying the two values<br />
together. This allows you to sort Events by Rank when viewing DPI or <strong>Firewall</strong> Events.<br />
Direction: The direction of the affected packet (incoming or outgoing).<br />
© Copyright 2010 <strong>Trend</strong> <strong>Micro</strong> Inc. www.trendmicro.com<br />
All rights reserved. - 28 -