Sustainable Agriculture Literature Review - Boulder County
Sustainable Agriculture Literature Review - Boulder County
Sustainable Agriculture Literature Review - Boulder County

Create successful ePaper yourself
Turn your PDF publications into a flip-book with our unique Google optimized e-Paper software.
! !!<br />
"#$%&!'())!! !!!!!!!!!!!!!!!!!!!!!!!!!!!!!!!!!!!!!!!!!!!!!!!!!!!!!!!!!!!!!!))+!9-%#/!H%-5-BF!<br />
11.1 Income<br />
The number of farms in the state of Colorado has remained relatively constant in recent<br />
years. From 2002 to 2007, Colorado’s agricultural sector experienced a 34 percent<br />
increase in market value (to $6,061,134,000), 33 percent of which came from crop<br />
production and the remaining 67 percent from livestock production. 825 However, between<br />
2008 and 2009 the agricultural sector as a whole saw a six percent decrease in output<br />
(to $6,639,721,000) and a 19 percent decrease in net value added (to $1,632,283,000).<br />
Farm operators have also seen a 37 percent decrease in net income, down from<br />
$1,178,935,000 in 2008 to $744,918,000 in 2009. 826<br />
<strong>Boulder</strong> <strong>County</strong> saw a much smaller, four percent, increase in market value between<br />
2002 and 2007. In contrast to the State, a substantial percentage of agricultural market<br />
value, 76 percent, was generated from crop production, while only 24 percent came from<br />
livestock production. <strong>Boulder</strong> <strong>County</strong> experienced a 28 percent increase in agricultural<br />
acreage from 2002 to 2007 compared to only a two percent increase for the entire state.<br />
This increase can be partially attributed to an increase in the number and diversity of<br />
farms responding to the 2007 Census in <strong>Boulder</strong> <strong>County</strong>. In these same years, the<br />
largest increases in production in <strong>Boulder</strong> <strong>County</strong> included haylage (1,107.3 percent),<br />
carrots (500 percent), angora goats (307.1 percent), and grapes (300 percent). The<br />
largest decreases included the number of pigs and hogs sold (69.2 percent), cantaloupe<br />
(66.7 percent), the value of pigs and hogs sold (64.6 percent), and the number of milk<br />
goats (51.6 percent). 827<br />
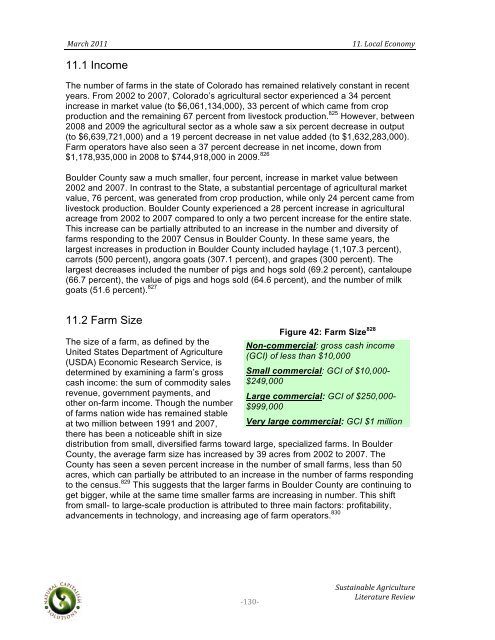
11.2 Farm Size<br />
The size of a farm, as defined by the<br />
United States Department of <strong>Agriculture</strong><br />
(USDA) Economic Research Service, is<br />
determined by examining a farm’s gross<br />
cash income: the sum of commodity sales<br />
revenue, government payments, and<br />
other on-farm income. Though the number<br />
of farms nation wide has remained stable<br />
at two million between 1991 and 2007,<br />
there has been a noticeable shift in size<br />
!<br />
"')&"<br />
Figure 42: Farm Size 828<br />
Non-commercial: gross cash income<br />
(GCI) of less than $10,000<br />
Small commercial: GCI of $10,000-<br />
$249,000<br />
Large commercial: GCI of $250,000-<br />
$999,000<br />
Very large commercial: GCI $1 million<br />
distribution from small, diversified farms toward large, specialized farms. In <strong>Boulder</strong><br />
<strong>County</strong>, the average farm size has increased by 39 acres from 2002 to 2007. The<br />
<strong>County</strong> has seen a seven percent increase in the number of small farms, less than 50<br />
acres, which can partially be attributed to an increase in the number of farms responding<br />
to the census. 829 This suggests that the larger farms in <strong>Boulder</strong> <strong>County</strong> are continuing to<br />
get bigger, while at the same time smaller farms are increasing in number. This shift<br />
from small- to large-scale production is attributed to three main factors: profitability,<br />
advancements in technology, and increasing age of farm operators. 830<br />
!,342#.5#6/1!78$.%3/23$1!<br />
9.21$#23$1!:1;.1