national multiple family submetering and allocation billing program ...
national multiple family submetering and allocation billing program ...
national multiple family submetering and allocation billing program ...

Create successful ePaper yourself
Turn your PDF publications into a flip-book with our unique Google optimized e-Paper software.
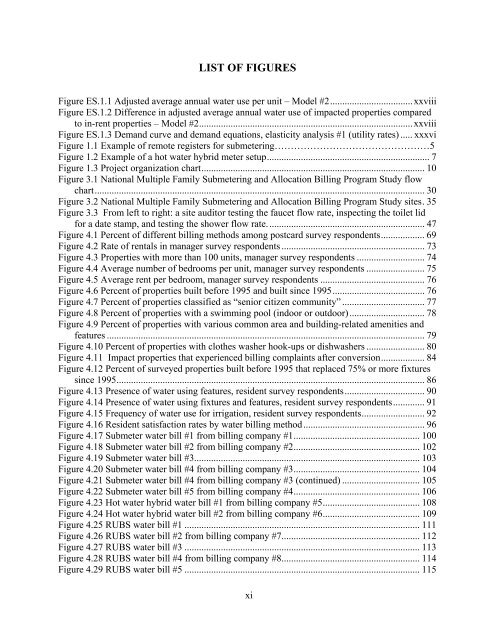
LIST OF FIGURES<br />
Figure ES.1.1 Adjusted average annual water use per unit – Model #2..................................xxviii<br />
Figure ES.1.2 Difference in adjusted average annual water use of impacted properties compared<br />
to in-rent properties – Model #2........................................................................................xxviii<br />
Figure ES.1.3 Dem<strong>and</strong> curve <strong>and</strong> dem<strong>and</strong> equations, elasticity analysis #1 (utility rates) ..... xxxvi<br />
Figure 1.1 Example of remote registers for <strong>submetering</strong>…………………………………………5<br />
Figure 1.2 Example of a hot water hybrid meter setup................................................................... 7<br />
Figure 1.3 Project organization chart............................................................................................ 10<br />
Figure 3.1 National Multiple Family Submetering <strong>and</strong> Allocation Billing Program Study flow<br />
chart........................................................................................................................................ 30<br />
Figure 3.2 National Multiple Family Submetering <strong>and</strong> Allocation Billing Program Study sites. 35<br />
Figure 3.3 From left to right: a site auditor testing the faucet flow rate, inspecting the toilet lid<br />
for a date stamp, <strong>and</strong> testing the shower flow rate................................................................. 47<br />
Figure 4.1 Percent of different <strong>billing</strong> methods among postcard survey respondents.................. 69<br />
Figure 4.2 Rate of rentals in manager survey respondents ........................................................... 73<br />
Figure 4.3 Properties with more than 100 units, manager survey respondents ............................ 74<br />
Figure 4.4 Average number of bedrooms per unit, manager survey respondents ........................ 75<br />
Figure 4.5 Average rent per bedroom, manager survey respondents ........................................... 76<br />
Figure 4.6 Percent of properties built before 1995 <strong>and</strong> built since 1995...................................... 76<br />
Figure 4.7 Percent of properties classified as “senior citizen community” .................................. 77<br />
Figure 4.8 Percent of properties with a swimming pool (indoor or outdoor)............................... 78<br />
Figure 4.9 Percent of properties with various common area <strong>and</strong> building-related amenities <strong>and</strong><br />
features ................................................................................................................................... 79<br />
Figure 4.10 Percent of properties with clothes washer hook-ups or dishwashers ........................ 80<br />
Figure 4.11 Impact properties that experienced <strong>billing</strong> complaints after conversion.................. 84<br />
Figure 4.12 Percent of surveyed properties built before 1995 that replaced 75% or more fixtures<br />
since 1995............................................................................................................................... 86<br />
Figure 4.13 Presence of water using features, resident survey respondents................................. 90<br />
Figure 4.14 Presence of water using fixtures <strong>and</strong> features, resident survey respondents............. 91<br />
Figure 4.15 Frequency of water use for irrigation, resident survey respondents.......................... 92<br />
Figure 4.16 Resident satisfaction rates by water <strong>billing</strong> method.................................................. 96<br />
Figure 4.17 Submeter water bill #1 from <strong>billing</strong> company #1.................................................... 100<br />
Figure 4.18 Submeter water bill #2 from <strong>billing</strong> company #2.................................................... 102<br />
Figure 4.19 Submeter water bill #3............................................................................................. 103<br />
Figure 4.20 Submeter water bill #4 from <strong>billing</strong> company #3.................................................... 104<br />
Figure 4.21 Submeter water bill #4 from <strong>billing</strong> company #3 (continued) ................................ 105<br />
Figure 4.22 Submeter water bill #5 from <strong>billing</strong> company #4.................................................... 106<br />
Figure 4.23 Hot water hybrid water bill #1 from <strong>billing</strong> company #5........................................ 108<br />
Figure 4.24 Hot water hybrid water bill #2 from <strong>billing</strong> company #6........................................ 109<br />
Figure 4.25 RUBS water bill #1 ................................................................................................. 111<br />
Figure 4.26 RUBS water bill #2 from <strong>billing</strong> company #7......................................................... 112<br />
Figure 4.27 RUBS water bill #3 ................................................................................................. 113<br />
Figure 4.28 RUBS water bill #4 from <strong>billing</strong> company #8......................................................... 114<br />
Figure 4.29 RUBS water bill #5 ................................................................................................. 115<br />
xi