- Page 1 and 2:
NATIONAL MULTIPLE FAMILY SUBMETERIN
- Page 3 and 4:
CONTENTS LIST OF TABLES............
- Page 5 and 6:
Matched-Pair Analysis .............
- Page 7 and 8:
LIST OF TABLES Table ES.1.1 Breakdo
- Page 9:
Table 6.6 Elasticity values, analys
- Page 12 and 13:
Figure 4.30 RUBS water bill #6 ....
- Page 14 and 15:
investigated local water savings as
- Page 16 and 17:
We are grateful to the members of a
- Page 18 and 19:
quantitative aspects of separate bi
- Page 20 and 21:
3. Owner/postcard survey: To identi
- Page 22 and 23:
"averages" of impact property water
- Page 24 and 25:
in-rent properties, others used the
- Page 26 and 27:
of these models included the billin
- Page 28 and 29:
70 Average Annual Water Use Per Uni
- Page 30 and 31:
COSTS AND BENEFITS Beyond quantifyi
- Page 32 and 33:
service charge, then the resident w
- Page 34 and 35:
Billing Method Efficient Fixtures?
- Page 36 and 37:
70 Avg. Water Use per MF Unit (kgal
- Page 38 and 39:
REGULATORY FRAMEWORK REVIEW The fra
- Page 40 and 41:
Table ES.1.12 NSUAA Summary of Stat
- Page 42 and 43:
above, the researchers offer the fo
- Page 44 and 45:
service is preferable, and would he
- Page 46 and 47:
practices (BMPs) should be implemen
- Page 48 and 49:
infrastructure of the building and
- Page 50:
multi-family housing. The transfer
- Page 53 and 54:
CHAPTER 1 INTRODU CTION More and mo
- Page 55 and 56:
In 1998, 15.0%, or 15.4 million, of
- Page 57 and 58:
TERMINOLOGY AND DEFINITIONS OF BILL
- Page 59 and 60:
submetering. With utility-submeteri
- Page 61 and 62:
all the two bedroom units for $20 p
- Page 63 and 64:
HOW TO USE THIS REPORT This report
- Page 67 and 68:
CHAPTER 2 LITERAT URE REVIEW As the
- Page 69 and 70:
A review of the literature unearthe
- Page 71 and 72:
The price elasticity of water deman
- Page 73 and 74:
expected. Additionally, McClelland
- Page 75 and 76:
submetered and five control (in-ren
- Page 77 and 78:
Another study might want to target
- Page 81 and 82:
CHAPTER 3 RESEARC H METHODS, APPROA
- Page 83 and 84:
1. Selection of participating study
- Page 85 and 86:
STUDY SITE SELECTION The Study aime
- Page 87 and 88:
Figure 3.2 National Multiple Family
- Page 89 and 90:
Matched pair protocol/survey - conf
- Page 91 and 92:
information given the available bud
- Page 93 and 94:
survey. Service companies that prov
- Page 95 and 96:
in “business to business” calli
- Page 97 and 98:
MATCHED PAIR SAMPLE The purpose of
- Page 99 and 100:
The second part of the visit requir
- Page 101 and 102:
epresentative of a known population
- Page 103 and 104:
51 Table 3.7 Postcard survey statis
- Page 105 and 106:
Table 3.8 Comparison of annual wate
- Page 107 and 108:
postcard survey. Nevertheless, exam
- Page 109 and 110:
confidence interval ranged from 49.
- Page 111 and 112:
particular property (e.g., the mont
- Page 113 and 114:
State PUC officials - water commiss
- Page 115:
10. The PROPID number appearing on
- Page 118 and 119:
These costs represent the commodity
- Page 120 and 121:
The postcard survey provided inform
- Page 122 and 123:
Table 4.4 Average number of units f
- Page 124 and 125:
Two-thirds of the properties that r
- Page 126 and 127:
Percent of Surveyed Properties with
- Page 128 and 129:
$700 Average Rent Per Bedroom ($) $
- Page 130 and 131:
Percent of Surveyed Properties with
- Page 132 and 133:
Impact properties were also more li
- Page 134 and 135:
Table 4.8 Issues considered before
- Page 136 and 137:
Percent of Surveyed Impact Properti
- Page 138 and 139:
60% Percent of Surveyed Properties
- Page 140 and 141:
From the visits, it was found that
- Page 142 and 143:
100% Percent of Surveyed Residents
- Page 144 and 145:
Roughly similar proportions of resi
- Page 146 and 147:
inserts for toilets (21%) or low-fl
- Page 148 and 149:
proportion were unsure, 37% from su
- Page 150 and 151:
Table 4.18 Ownership and rental rat
- Page 152 and 153:
Figure 4.17 Submeter water bill #1
- Page 154 and 155:
Figure 4.18 Submeter water bill #2
- Page 156 and 157: Figure 4.20 Submeter water bill #4
- Page 158 and 159: wastewater rates are not shown so t
- Page 160 and 161: Figure 4.23 Hot water hybrid water
- Page 162 and 163: RUBS Sample Bills Seven sample RUBS
- Page 164 and 165: wastewater rates are not shown so t
- Page 166 and 167: Figure 4.28 RUBS water bill #4 from
- Page 168 and 169: Figure 4.30 RUBS water bill #6 RUBS
- Page 170 and 171: directly to and then paid by the th
- Page 172 and 173: never subtracting for common area w
- Page 174 and 175: Late Fees At the start of water bil
- Page 176 and 177: 124
- Page 178 and 179: intuitively clear, and matches comm
- Page 180 and 181: Indoor water use was normalized on
- Page 182 and 183: Table 5.3 Summarized water use anal
- Page 184 and 185: easonable assumption since there is
- Page 186 and 187: Figure 5.1 shows the frequency dist
- Page 188 and 189: 40 Difference in Annual Water Use p
- Page 190 and 191: after 1995. By including only those
- Page 192 and 193: 70 Average Annual Water Use Per Uni
- Page 194 and 195: Table 5.11 Statistical tests compar
- Page 196 and 197: Factors that Influence Water Use Th
- Page 198 and 199: Table 5.12 Association of categoric
- Page 200 and 201: Indoor Water Use per Unit in 2001 I
- Page 202 and 203: Table 5.13 Continuous factors from
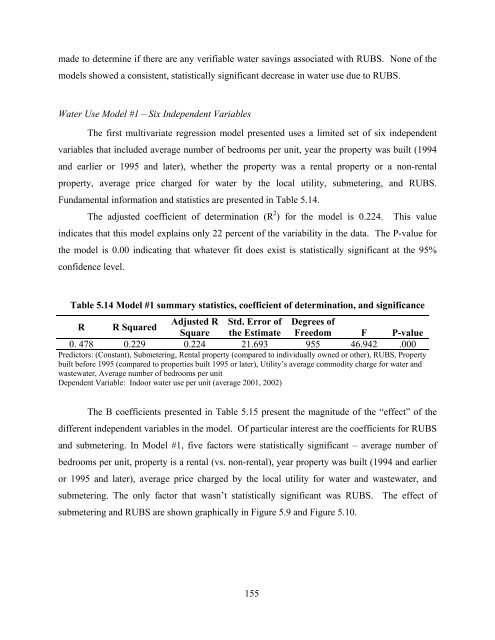
- Page 204 and 205: Multivariate Models to Determine Im
- Page 208 and 209: 70 Average Annual Water Use Per Uni
- Page 210 and 211: A = Beta coefficient for “Propert
- Page 212 and 213: substantially reduces the sample si
- Page 214 and 215: Table 5.17 Model #2 coefficients an
- Page 216 and 217: 0.00 indicating that whatever fit d
- Page 218 and 219: commodity charge for water and wast
- Page 220 and 221: properties having generally lower w
- Page 222 and 223: 110 Average Annual Water Use Per Un
- Page 224 and 225: analysis, intended to control best
- Page 226 and 227: Table 5.27 Paired samples test, all
- Page 228 and 229: Table 5.30 Estimated water use befo
- Page 230 and 231: Table 5.33 Comparison of water savi
- Page 232 and 233: 180
- Page 234 and 235: sector only reduced usage by 18% (A
- Page 236 and 237: Table 6.1 Avoided costs from submet
- Page 238 and 239: submetered. Complete responses of c
- Page 240 and 241: included in this cost/benefit analy
- Page 242 and 243: Table 6.3 Cost and benefit for owne
- Page 244 and 245: Perceived Concerns In the resident
- Page 246 and 247: With a service fee, residents could
- Page 248 and 249: Table 6.4 Economic return for a res
- Page 250 and 251: ANALYSIS OF PRICE ELASTICITIES Econ
- Page 252 and 253: concluded that if a single elastici
- Page 254 and 255: esults from this analysis point to
- Page 256 and 257:
over which they have control than d
- Page 258 and 259:
According to the basic consumer cho
- Page 260 and 261:
The consumer choice problem can be
- Page 262 and 263:
210
- Page 264 and 265:
water systems from compliance with
- Page 266 and 267:
and methods of practice. NIST publi
- Page 268 and 269:
Table 7.1 NSUAA Summary of State Re
- Page 270 and 271:
New Surveys of State Agencies and W
- Page 272 and 273:
the AWWA WaterStats 1999 database.
- Page 274 and 275:
Measures, which dispatches a public
- Page 276 and 277:
Mississippi, Missouri, Pennsylvania
- Page 278 and 279:
226 Table 7.6 Summary of utility re
- Page 280 and 281:
DISCUSSION - KEY EXAMPLES OF STATE
- Page 282 and 283:
ill. Condominium associations are g
- Page 284 and 285:
under construction after January 1,
- Page 286 and 287:
Weights and Measures Regulation In
- Page 288 and 289:
from the submetering. Meter testing
- Page 290 and 291:
clean and decent housing or the lac
- Page 292 and 293:
240
- Page 294 and 295:
NATIONAL ORGANIZATIONAL STRUCTURE F
- Page 296 and 297:
complaints in all 50 states and app
- Page 298 and 299:
- Meters must demonstrate in testin
- Page 300 and 301:
- Plumbing systems are space constr
- Page 302 and 303:
(2) Twisted or kinked flex supply l
- Page 304 and 305:
252
- Page 306 and 307:
Estimated Water Use By Different Bi
- Page 308 and 309:
there are clear benefits to these s
- Page 310 and 311:
study site. These values were then
- Page 312 and 313:
immediately strengthens the owner's
- Page 314 and 315:
among the nation's key strategies f
- Page 316 and 317:
all repair and replacement decision
- Page 318 and 319:
These findings underscore the obser
- Page 320 and 321:
varies with volume of use) for mult
- Page 322 and 323:
Recommendation 6 - Efficient plumbi
- Page 324 and 325:
financially responsible for their o
- Page 326 and 327:
individual unit, the volume allocat
- Page 328 and 329:
RECOMMENDATIONS FOR FURTHER RESEARC
- Page 330 and 331:
Fixed rates - Part of a master mete
- Page 332 and 333:
Total-capture submetering - a type
- Page 334 and 335:
282
- Page 336 and 337:
Corral, L.R. 1997. Price and Non-Pr
- Page 338 and 339:
McClelland, L. 1980. Encouraging En
- Page 340:
Young, C.E., K.R. Kinsley and W.E.