- Page 1 and 2:
Neurotechnology Research Systems Us
- Page 3 and 4:
CinePlex Video, Capture, Tracking,
- Page 5 and 6:
Plexon Inc Publication History iii
- Page 7 and 8:
Plexon Inc Contents v Publication H
- Page 9 and 10:
Plexon Inc CinePlex vii File Toolba
- Page 11 and 12:
Plexon Inc CinePlex ix Appendix B P
- Page 13 and 14:
Plexon Inc Chapter 1 CinePlex Syste
- Page 15 and 16:
— All-digital imaging with one or
- Page 17 and 18:
stamped with corresponding MAP time
- Page 19 and 20:
Editor features, see “Offline ext
- Page 21 and 22:
1.3 CinePlex System Hardware and So
- Page 23 and 24:
The Quad MAP Controller (QMC) can c
- Page 25 and 26:
1.4 Data Analysis After recording,
- Page 27 and 28:
Plexon Inc Chapter 2 Using CinePlex
- Page 29 and 30:
2.2 Designing the Experiment The pr
- Page 31 and 32:
2.4 Performing an Operational Test
- Page 33 and 34:
4 Start Sort Client program and ver
- Page 35 and 36:
7 Start CinePlex Studio program. Th
- Page 37 and 38:
will not be able to distinguish the
- Page 39 and 40:
2.5.4.2.3 LEDs in Light with Reflec
- Page 41 and 42:
the object and the yellow rectangle
- Page 43 and 44:
2.5.4.3.7 Multicolored Animal. The
- Page 45 and 46:
Selecting the Tracking Mode 1 Selec
- Page 47 and 48:
3 Check the color to track (by clic
- Page 49 and 50:
that sizes, positions and velocitie
- Page 51 and 52:
d e Measure its longest dimension i
- Page 53 and 54:
In the above image note that the si
- Page 55 and 56:
d e Measure the feature’s horizon
- Page 57 and 58:
i If the current color in the box n
- Page 59 and 60:
n Go to the slider next to the Vert
- Page 61 and 62:
6 Repeat these steps for each addit
- Page 63 and 64:
Defining Logical Events Logical eve
- Page 65 and 66:
1 Click the Add new combination of
- Page 67 and 68:
2.6 Executing the Experiment Plan T
- Page 69 and 70:
also use a variety of commercial so
- Page 71 and 72:
When the Start button is clicked, S
- Page 73 and 74:
Note: If Studio is armed on one day
- Page 75 and 76:
settings and use the file mode to d
- Page 77 and 78:
2 To set or change the folder locat
- Page 79 and 80:
3 Open a second Windows Explorer an
- Page 81 and 82:
2.7 Global Configuration Pane The G
- Page 83 and 84:
2.8 Source Pane The Source Pane def
- Page 85 and 86:
The Arena Definition is also used t
- Page 87 and 88:
• In Reflective Colors mode, pixe
- Page 89 and 90:
Configuring CinePlex Studio to trac
- Page 91 and 92:
emove progressively larger features
- Page 93 and 94:
The illustration below is taken aft
- Page 95 and 96:
Configuring CinePlex Studio to trac
- Page 97 and 98:
2 In the Video window a square area
- Page 99 and 100:
If Pure Colors is not selected, the
- Page 101 and 102:
Increase the threshold to reduce th
- Page 103 and 104:
2.10 Operating CinePlex Studio with
- Page 105 and 106:
To verify CinePlex Studio data acqu
- Page 107 and 108:
3 In the Control View, click Connec
- Page 109 and 110:
2.10.1.1 Control View VTViewer disp
- Page 111 and 112:
2.10.1.3 VTViewer Options The Optio
- Page 113 and 114:
2.11 CinePlex Studio Offline Mode 2
- Page 115 and 116:
• Sequences Pane(s) (if behavior
- Page 117 and 118:
2.13 CinePlex Studio Test Mode Test
- Page 119 and 120:
2.14 Operation with the Quad MAP Co
- Page 121 and 122:
6 Connect a push button switch (09-
- Page 123 and 124:
Version 3.0 111
- Page 125 and 126:
15 On each CPX, launch and arm CPX.
- Page 127 and 128:
2.15 Using the Extractor This chapt
- Page 129 and 130:
illustrates. Note that the Marker 4
- Page 131 and 132:
Plexon Inc Chapter 3 CinePlex Studi
- Page 133 and 134:
3.2.1 Static Configuration Pane The
- Page 135 and 136:
3.2.1.2.1 Camera Group. The Camera
- Page 137 and 138:
• Brightness - this setting speci
- Page 139 and 140:
3.2.1.3 Tracking Tabs One of three
- Page 141 and 142:
3.2.1.4.1 Object Contour Tracker Gr
- Page 143 and 144:
• Object Transparency - This sett
- Page 145 and 146:
• Cent. Grav. Size - This setting
- Page 147 and 148:
• Mrk1Threshold, Mrk2Threshold, M
- Page 149 and 150:
3.2.2 Dynamic Configuration Pane Th
- Page 151 and 152:
• Subtract shapes - - this button
- Page 153 and 154:
• Add zone to selected sequence -
- Page 155 and 156:
• Delete selected tracking event
- Page 157 and 158:
3.2.2.4.1 Toolbar. The toolbar cont
- Page 159 and 160:
Note: The effects of the Image Qual
- Page 161 and 162:
— Name - this value depends on wh
- Page 163 and 164:
3.3 Menus The CinePlex Studio File
- Page 165 and 166:
3.3.3 DVR Menu 3.3.3.1 Arm Clicking
- Page 167 and 168:
3.4 Toolbars The File, DVR and Trac
- Page 169 and 170:
ow,time,x1,y1,x2,y2,x3,y3,x4,y4,x5,
- Page 171 and 172:
3.6.3 Source Settings The Source se
- Page 173 and 174:
Plexon Inc Chapter 4 Using CinePlex
- Page 175 and 176:
4.1.3 Changing and Saving Project F
- Page 177 and 178:
4.2.2 Setting Up a New Project This
- Page 179 and 180:
4.2.3 Understanding the CinePlex Ed
- Page 181 and 182:
4.2.4 Defining a New Marker This pr
- Page 183 and 184:
Markers window in the Name column a
- Page 185 and 186:
3 In the Format area, accept the de
- Page 187 and 188:
4.4 Customizing the User Interface
- Page 189 and 190:
In the Input window, select an inpu
- Page 191 and 192:
matically advances the video by a p
- Page 193 and 194:
4.5.3 Editing Markers and Marker Oc
- Page 195 and 196:
Selected Marker Occurrence, or clic
- Page 197 and 198:
3 Select entries in the Marker 1 an
- Page 199 and 200:
is defined and selected. A more sop
- Page 201 and 202:
corner of the image. If the video r
- Page 203 and 204:
Finding marker occurrences with a b
- Page 205 and 206:
2 Choose a marker from the Marker l
- Page 207 and 208:
Interpolating missing occurrences 1
- Page 209 and 210:
lowing illustration idx indicates t
- Page 211 and 212:
6 The user may set the columns for
- Page 213 and 214:
4.6 CinePlex Editor How-Tos This se
- Page 215 and 216: However, do not expand the range so
- Page 217 and 218: name and click Export! The Export C
- Page 219 and 220: 7 Repeat Step 6 until all the coord
- Page 221 and 222: Plexon Inc Chapter 5 CinePlex Edito
- Page 223 and 224: 5.2 Main Window This section descri
- Page 225 and 226: Show Complete Tail feature is usefu
- Page 227 and 228: The color drawn at point p in the t
- Page 229 and 230: — By pressing the PAGE UP or PAGE
- Page 231 and 232: • Automatically Adjust Label Area
- Page 233 and 234: Note: — Type - In the Type area,
- Page 235 and 236: ox and select a different key. When
- Page 237 and 238: Note: By default, if the Show check
- Page 239 and 240: — Data Type: - This item contains
- Page 241 and 242: 5.2.8.1 Function The Messages windo
- Page 243 and 244: • Add, Edit, and Delete Marker Oc
- Page 245 and 246: • Reset Automatic Range Adjustmen
- Page 247 and 248: 5.3 Menus Menus provide access to C
- Page 249 and 250: — Video Data Input File (AVI) - T
- Page 251 and 252: After verifying that the correct fi
- Page 253 and 254: • Which Markers - The default val
- Page 255 and 256: • File - Type an export file name
- Page 257 and 258: 5.3.2 Edit Menu The following illus
- Page 259 and 260: Note: The Edit Marker dialog box ma
- Page 261 and 262: • Marker - This box shows the mar
- Page 263 and 264: 5.3.4.7 Step Forward This button ad
- Page 265: 5.3.6 Find Menu The following illus
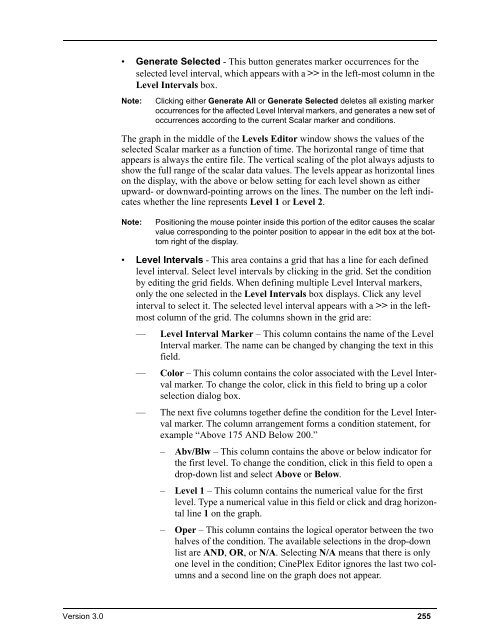
- Page 269 and 270: • Generate All - This button gene
- Page 271 and 272: — Zone Interval • Operation to
- Page 273 and 274: 5.3.7.5 Snap-To Marker Occurrences
- Page 275 and 276: — max - the largest time differen
- Page 277 and 278: 5.3.7.8.1 General Tab. • Initial
- Page 279 and 280: 5.3.7.8.3 Latency Correction Tab. F
- Page 281 and 282: 5.3.7.8.5 Audio Tab. • Available
- Page 283 and 284: — Background - This is the backgr
- Page 285 and 286: 5.4 Toolbars CinePlex Editor includ
- Page 287 and 288: 5.5 How CinePlex Editor Creates Ini
- Page 289 and 290: then load a neural data file that c
- Page 291 and 292: Marker Type Abbr Information Stored
- Page 293 and 294: From the Marker Occurrences window
- Page 295 and 296: Note that applying this correction
- Page 297 and 298: Snap-To Marker Occurrences tool des
- Page 299 and 300: 5.10 Analyzing CinePlex Studio data
- Page 301 and 302: Plexon Inc Appendix A Installation
- Page 303 and 304: Procedure for MAP/CPX Computer Hard
- Page 305 and 306: A.2 Installation - Software This se
- Page 307 and 308: 3 The End User License Agreement wi
- Page 309 and 310: 7 The Select Program Manager Group
- Page 311 and 312: 11 The following window appears twi
- Page 313 and 314: 14 Click Next on the window below.
- Page 315 and 316: 18 The CinePlex installation has no
- Page 317 and 318:
3 The End User License Agreement wi
- Page 319 and 320:
7 The Select Program Manager Group
- Page 321 and 322:
11 Next, the Sentinel Key Drivers a
- Page 323 and 324:
15 Click Finish on the window below
- Page 325 and 326:
2 The Welcome window appears. Press
- Page 327 and 328:
6 The Select Components window appe
- Page 329 and 330:
10 Nothing else will be installed,
- Page 331 and 332:
3 After step 6 continue the procedu
- Page 333 and 334:
Note: to remote upgrades. If a remo
- Page 335 and 336:
Plexon Inc Appendix B Problem Resol
- Page 337 and 338:
toggle switch above these connector
- Page 339 and 340:
the CinePlex software will be requi
- Page 341 and 342:
1 Remove the TIM card and check tha
- Page 343 and 344:
1 Stop running all unnecessary appl
- Page 345 and 346:
B.3 CinePlex Studio Messages The ta
- Page 347 and 348:
Table 1: CinePlex Studio Simple Mes
- Page 349 and 350:
Table 2: CinePlex Studio Critical M
- Page 351 and 352:
Plexon Inc Appendix C Lens Selectio
- Page 353 and 354:
C.2 Lens Selection For CinePlex Ver
- Page 355 and 356:
C.3 Experiment Design C.3.1 Field o
- Page 357 and 358:
The formula to calculate the optimu
- Page 359 and 360:
3 Three Arm Phenolic Knob (small) -
- Page 361 and 362:
• A local professional camera or
- Page 363 and 364:
a Place the sandwich plate on the o
- Page 365 and 366:
7 The tripod adaptor should already
- Page 367 and 368:
Port 1 Port 2 Port 1 Port 2 Port 3
- Page 369 and 370:
3 Using the Plexon camera mounting
- Page 371 and 372:
Plexon Inc Appendix D Plexon User I
- Page 373 and 374:
D.2 Screen Elements D.2.1 Menus The
- Page 375 and 376:
D.2.2 Toolbars Each toolbar has a d
- Page 377 and 378:
• Close Button - The Close button
- Page 379 and 380:
— Hidden Windows - Docked windows
- Page 381 and 382:
D.3 Standard Menu Items and Dialogs
- Page 383 and 384:
D.3.2 Run Menu The purpose of the R
- Page 385 and 386:
— Licensing - Clicking the Licens
- Page 387 and 388:
D.3.4 Messages Window The Messages
- Page 389 and 390:
D.4 Customization Although the menu
- Page 391 and 392:
• Category - This is a list of al
- Page 393 and 394:
• Buttons - The toolbar buttons a
- Page 395 and 396:
Plexon Inc Appendix E Cabling Guide
- Page 397 and 398:
E.2 Typical MAP/CPX Cabling Diagram
- Page 399 and 400:
E.3 Typical MAP/CPX System Cabling
- Page 401 and 402:
E.3.2 MAP/CPX System with Two Video
- Page 403 and 404:
E.4 MAP/CPX Cable Images Version 3.
- Page 405 and 406:
E.5.2.2 With CHUB Version 3.0 E-11
- Page 407 and 408:
E.5.3.2 Two Video Cameras Version 3
- Page 409 and 410:
* CinePlex, Plexon, and the Plexon


