

Volume II - DISE
Volume II - DISE
Volume II - DISE

You also want an ePaper? Increase the reach of your titles
YUMPU automatically turns print PDFs into web optimized ePapers that Google loves.
District<br />
FARIDKOT<br />
State Punjab<br />
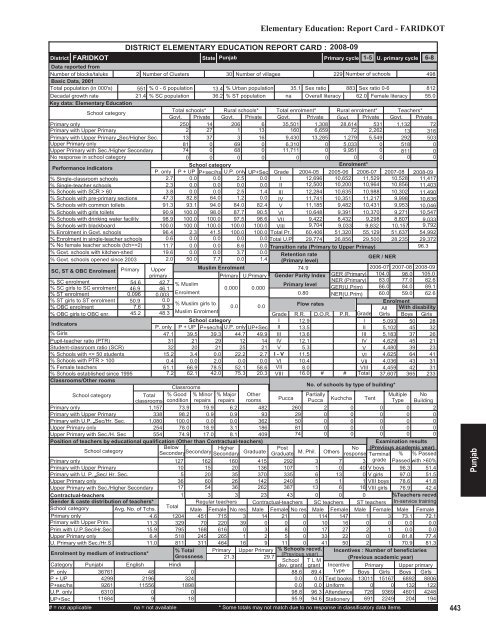
Elementary Education: Report Card - FARIDKOT<br />
DISTRICT ELEMENTARY EDUCATION REPORT CARD : 2008-09<br />
Primary cycle<br />
1-5 U. primary cycle 6-8<br />
Data reported from<br />
Number of blocks/taluks<br />
2 Number of Clusters 30 Number of villages<br />
229 Number of schools<br />
498<br />
Basic Data, 2001<br />
Total population (in 000's) 551 % 0 - 6 population 13.4 % Urban population 35.1 Sex ratio 883 Sex ratio 0-6<br />
812<br />
Decadal growth rate<br />
21.4 % SC population 36.2 % ST population na Overall literacy 62.0 Female literacy 55.0<br />
Key data: Elementary Education<br />
School category<br />
Total schools* Rural schools* Total enrolment* Rural enrolment* Teachers*<br />
Govt. Private Govt. Private Govt. Private Govt. Private Govt. Private<br />
Primary only<br />
250 14 206 6 35,501 1,308 28,614 531 1,132 72<br />
Primary with Upper Primary<br />
2 27 1 13 160 6,659 72 2,262 13 316<br />
Primary with Upper Primary Sec/Higher Sec. 13 37 3 16 9,430 13,285 1,279 5,549 292 503<br />
Upper Primary only<br />
81 0 69 0 6,310 0 5,033 0 518 0<br />
Upper Primary with Sec./Higher Secondary<br />
74 0 68 0 11,711 0 9,951 0 811 0<br />
No response in school category<br />
0 0 0 0 0 0 0 0 0 0<br />
Performance indicators<br />
School category<br />
Enrolment*<br />
P. only P + UP P+sec/hs U.P. only UP+Sec Grade 2004-05 2005-06 2006-07 2007-08 2008-09<br />
% Single-classroom schools<br />
2.7 0.0 0.0 2.5 0.0 I 12,696 10,652 11,529 10,528 11,417<br />
% Single-teacher schools<br />
2.3 0.0 0.0 0.0 0.0 <strong>II</strong> 12,500 10,200 10,964 10,856 11,403<br />
% Schools with SCR > 60<br />
3.8 0.0 0.0 2.5 1.4 <strong>II</strong>I 12,284 10,635 10,988 10,302 11,490<br />
% Schools with pre-primary sections 47.3 82.8 64.0 1.2 0.0 IV 11,741 10,351 11,217 9,998 10,636<br />
% Schools with common toilets 91.3 93.1 94.0 84.0 82.4 V 11,185 9,482 10,431 9,953 10,046<br />
% Schools with girls toilets 90.9 100.0 98.0 87.7 90.5 VI 10,648 9,391 10,370 9,271 10,547<br />
% Schools with drinking water facility 98.9 100.0 100.0 97.5 98.6 V<strong>II</strong> 9,422 8,432 9,298 8,807 9,033<br />
% Schools with blackboard<br />
100.0 100.0 100.0 100.0 100.0 V<strong>II</strong>I 9,704 9,033 9,832 10,157 9,792<br />
% Enrolment in Govt. schools 96.4 2.3 41.5 100.0 100.0 Total Pr. 60,406 51,320 55,129 51,637 54,992<br />
% Enrolment in single-teacher schools 0.6 0.0 0.0 0.0 0.0 Total U.P 29,774 26,856 29,500 28,235 29,372<br />
% No female teacher schools (tch>=2) 11.7 0.0 0.0 8.6 0.0 Transition rate (Primary to Upper Primay)<br />
96.3<br />
% Govt. schools with kitchen-shed 19.6 0.0 0.0 3.7 0.0 Retention rate<br />
% Govt. schools opened since 2003 2.0 50.0 7.7 0.0 1.4 (Primary level)<br />
/ NER<br />
GER<br />
SC, ST & OBC Enrolment Primary Upper<br />
Muslim Enrolment<br />
74.9<br />
2006-07 2007-08 2008-09<br />
primary<br />
Primary U.Primary Gender Parity Index GER (Primary) 104.0 98.0 105.0<br />
% SC enrolment<br />
% SC girls to SC enrolment<br />
% ST enrolment<br />
% ST girls to ST enrolment<br />
% OBC enrolment<br />
% OBC girls to OBC enr.<br />
Indicators<br />
% Girls<br />
Pupil-teacher ratio (PTR)<br />
Student-classroom ratio (SCR)<br />
% Schools with 100<br />
% Female teachers<br />
% Schools established since 1995<br />
Classrooms/Other rooms<br />
54.6 42.7<br />
NER (Primary)<br />
% Muslim<br />
Primary level<br />
46.9 46.1<br />
0.000 0.000<br />
GER(U.Prim)<br />
0.096 0.003<br />
Enrolment<br />
0.80 NER(U.Prim)<br />
50.9 0.0<br />
% Muslim girls to<br />
0.0 0.0<br />
Flow rates<br />
7.6 9.3<br />
45.2 48.3 Muslim Enrolment<br />
Grade R.R. D.O.R. P.R. Grade<br />
School category<br />
I 12.9<br />
I<br />
P. only P + UP P+sec/hs U.P. only UP+Sec <strong>II</strong> 13.5<br />
<strong>II</strong><br />
47.1 39.5 39.3 44.7 49.9 <strong>II</strong>I 13.6<br />
<strong>II</strong>I<br />
31 21 29 12 14 IV 12.1<br />
IV<br />
32 20 21 25 21 V 5.3<br />
V<br />
15.2 3.4 0.0 22.2 2.7 I - V 11.5<br />
VI<br />
0.4 0.0 2.0 0.0 0.0 VI 10.4<br />
V<strong>II</strong><br />
61.1 66.9 78.5 52.1 58.6 V<strong>II</strong> 8.0<br />
V<strong>II</strong>I<br />
7.2 62.1 42.0 75.3 20.3 V<strong>II</strong>I 16.0 # # Total<br />
Classrooms<br />
School category<br />
Total<br />
classrooms<br />
% Good<br />
condition<br />
% Minor<br />
repairs<br />
% Major<br />
repairs<br />
Other<br />
rooms<br />
Primary only<br />
1,157 73.9 19.9 6.2 482<br />
Primary with Upper Primary<br />
338 98.2 0.9 0.9 93<br />
Primary with U.P. Sec/Hr. Sec. 1,080 100.0 0.0 0.0 362<br />
Upper Primary only<br />
254 78.0 18.9 3.1 186<br />
Upper Primary with Sec./H. Sec<br />
554 74.9 17.0 8.1 409<br />
Position of teachers by educational qualification (Other than Contractual-teachers)<br />
School category<br />
Below<br />
Secondary Higher<br />
Secondary<br />
Secondary Graduate<br />
Primary only<br />
127 162 160 415<br />
Primary with Upper Primary<br />
10 15 20 136<br />
Primary with U. P. Sec/ Hr. Sec.<br />
5 20 35 370<br />
Upper Primary only<br />
36 60 26 142<br />
Upper Primary with Sec./Higher Secondary 17 54 36 262<br />
Contractual-teachers<br />
Gender & caste distribution of teachers*<br />
School category Avg. No. of Tchs.<br />
Primary only<br />
4.6<br />
Primary with Upper Prim.<br />
11.3<br />
Prim.with U.P.Sec/Hr.Sec<br />
15.9<br />
Upper Primary only<br />
6.4<br />
U. Primary with Sec./Hr.S<br />
11.0<br />
Enrolment by medium of instructions*<br />
83.0<br />
86.0<br />
60.0<br />
No. of schools by type of building*<br />
Post<br />
No<br />
Graduate M. Phil. Others response<br />
77.0<br />
84.0<br />
59.0<br />
82.6<br />
89.1<br />
62.6<br />
Enrolment<br />
All With disability<br />
Girls Boys Girls<br />
5,093 50 28<br />
5,102 45 32<br />
5,183 37 26<br />
4,629 45 21<br />
4,480 39 23<br />
4,625 64 41<br />
4,036 43 31<br />
4,459 42 31<br />
37,607 365 233<br />
Pucca<br />
Partially<br />
Multiple No<br />
Pucca Kuchcha Tent Type Building<br />
260 2 0 0 0 2<br />
29 0 0 0 0 0<br />
50 0 0 0 0 0<br />
81 0 0 0 0 0<br />
74 0 0 0 0 0<br />
292 3 7<br />
107 1 0 40<br />
335 6 13 0<br />
240 5 1 1<br />
387 13 6 16<br />
1 3 3 23 43 0 0 0<br />
Total<br />
Regular teachers Contractual-teachers SC teachers ST teachers<br />
Male Female No res Male Female No res Male Female Male Female<br />
1204 451 715 3 14 21 0 114 147 1 3<br />
329 70 220 39 0 0 0 10 16 0 0<br />
795 168 616 0 3 8 0 17 27 2 1<br />
518 245 265 1 2 5 0 33 22 0 0<br />
811 311 464 16 9 11 0 41 50 2 1<br />
% Total Primary Upper Primary % Schools recvd.<br />
Grossness<br />
(Previous year)<br />
21.3<br />
29.7<br />
School T L M<br />
Hindi<br />
dev. grant grant<br />
Examination results<br />
(Previous academic year)<br />
Terminal % % Passed<br />
3 grade Passed with >60%<br />
V boys 96.3 51.4<br />
V girls 97.0 51.5<br />
V<strong>II</strong>I boys 78.6 41.8<br />
V<strong>II</strong>I girls 76.9 42.4<br />
%Teachers recvd.<br />
In-service training<br />
Male Female<br />
73.1 72.1<br />
0.0 0.0<br />
0.0 0.0<br />
81.8 77.4<br />
70.9 81.3<br />
Incentives : Number of beneficiaries<br />
(Previous academic year)<br />
Category Punjabi English<br />
Incentive<br />
P. only<br />
36761<br />
48<br />
0<br />
88.6 89.4 Type<br />
P + UP<br />
4299<br />
2196<br />
324<br />
0.0 0.0 Text books<br />
P+sec/hs<br />
9261 11556<br />
1898<br />
0.0 0.0 Uniform<br />
U.P. only<br />
6310<br />
0<br />
0<br />
98.8 96.3 Attendance<br />
UP+Sec<br />
11684<br />
9<br />
18<br />
95.9 94.6 Stationery<br />
# = not applicable na = not available * Some totals may not match due to no response in classificatory data items<br />
Primary Upper primary<br />
Boys Girls Boys Girls<br />
13011 15167 6892 8806<br />
0 0 132 122<br />
726 9369 4601 4248<br />
691 2249 204 194<br />
443<br />
Punjab


