

Volume II - DISE
Volume II - DISE
Volume II - DISE

You also want an ePaper? Increase the reach of your titles
YUMPU automatically turns print PDFs into web optimized ePapers that Google loves.
Uttar Pradesh<br />
578<br />
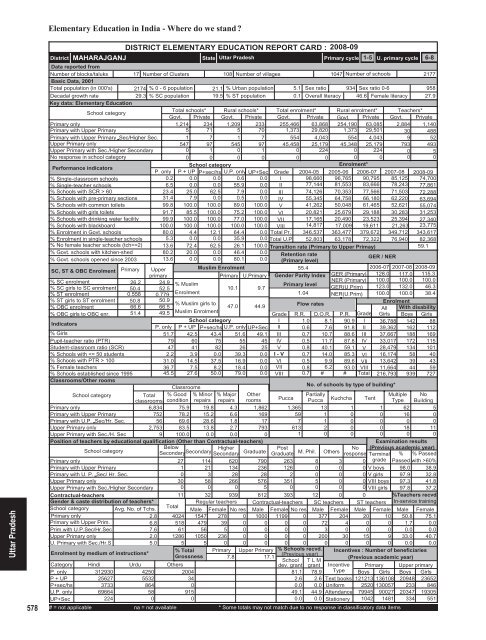
Elementary Education in India - Where do we stand <br />
District<br />
MAHARAJGANJ<br />
DISTRICT ELEMENTARY EDUCATION REPORT CARD : 2008-09<br />
State Uttar Pradesh<br />
Primary cycle<br />
1-5 U. primary cycle 6-8<br />
Data reported from<br />
Number of blocks/taluks 17 Number of Clusters 108 Number of villages<br />
1047 Number of schools<br />
2177<br />
Basic Data, 2001<br />
Total population (in 000's) 2174 % 0 - 6 population 21.1 % Urban population 5.1 Sex ratio 934 Sex ratio 0-6<br />
958<br />
Decadal growth rate<br />
29.3 % SC population 19.5 % ST population<br />
0.1 Overall literacy 46.6 Female literacy 27.9<br />
Key data: Elementary Education<br />
School category<br />
Total schools* Rural schools* Total enrolment* Rural enrolment* Teachers*<br />
Govt. Private Govt. Private Govt. Private Govt. Private Govt. Private<br />
Primary only<br />
1,214 234 1,209 233 255,466 63,868 254,190 63,085 2,884 1,140<br />
Primary with Upper Primary<br />
5 71 5 70 1,373 29,820 1,373 29,501 30 488<br />
Primary with Upper Primary Sec/Higher Sec.<br />
1 7 1 7 554 4,043 554 4,043 9 52<br />
Upper Primary only<br />
547 97 545 97 45,458 25,179 45,348 25,179 793 493<br />
Upper Primary with Sec./Higher Secondary<br />
0 1 0 1 0 224 0 224 0 5<br />
No response in school category<br />
0 0 0 0 0 0 0 0 0 0<br />
Performance indicators<br />
School category<br />
Enrolment*<br />
P. only P + UP P+sec/hs U.P. only UP+Sec Grade 2004-05 2005-06 2006-07 2007-08 2008-09<br />
% Single-classroom schools<br />
0.2 0.0 0.0 0.6 0.0 I 98,660 96,765 90,795 85,125 74,700<br />
% Single-teacher schools<br />
6.5 0.0 0.0 55.9 0.0 <strong>II</strong> 77,144 81,553 83,666 78,243 77,861<br />
% Schools with SCR > 60<br />
23.4 25.0 62.5 7.9 0.0 <strong>II</strong>I 74,126 70,353 77,566 71,503 72,288<br />
% Schools with pre-primary sections 31.4 7.9 0.0 0.5 0.0 IV 55,345 64,758 66,180 62,220 63,694<br />
% Schools with common toilets 99.8 100.0 100.0 89.0 100.0 V 41,262 50,048 61,465 52,621 55,074<br />
% Schools with girls toilets 91.7 85.5 100.0 75.2 100.0 VI 20,821 25,679 29,188 30,283 31,253<br />
% Schools with drinking water facility 99.9 100.0 100.0 77.0 100.0 V<strong>II</strong> 17,165 20,490 23,523 25,394 27,340<br />
% Schools with blackboard<br />
100.0 100.0 100.0 100.0 100.0 V<strong>II</strong>I 14,817 17,009 19,611 21,263 23,775<br />
% Enrolment in Govt. schools 80.0 4.4 12.1 64.4 0.0 Total Pr. 346,537 363,477 379,672 349,712 343,617<br />
% Enrolment in single-teacher schools 5.3 0.0 0.0 35.9 0.0 Total U.P 52,803 63,178 72,322 76,940 82,368<br />
% No female teacher schools (tch>=2) 13.6 72.4 62.5 26.1 100.0 Transition rate (Primary to Upper Primay)<br />
59.1<br />
% Govt. schools with kitchen-shed 80.2 20.0 0.0 46.4 0.0 Retention rate<br />
% Govt. schools opened since 2003 13.6 0.0 0.0 80.1 0.0 (Primary level)<br />
/ NER<br />
GER<br />
SC, ST & OBC Enrolment Primary Upper<br />
Muslim Enrolment<br />
55.4<br />
2006-07 2007-08 2008-09<br />
primary<br />
Primary U.Primary Gender Parity Index GER (Primary) 128.0 117.0 115.3<br />
% SC enrolment<br />
% SC girls to SC enrolment<br />
% ST enrolment<br />
% ST girls to ST enrolment<br />
% OBC enrolment<br />
% OBC girls to OBC enr.<br />
Indicators<br />
% Girls<br />
Pupil-teacher ratio (PTR)<br />
Student-classroom ratio (SCR)<br />
% Schools with 100<br />
% Female teachers<br />
% Schools established since 1995<br />
Classrooms/Other rooms<br />
26.2 24.9 % Muslim<br />
Primary level<br />
50.4 52.5<br />
10.1 9.7<br />
0.558 0.779<br />
Enrolment<br />
1.04<br />
50.8 50.9<br />
% Muslim girls to<br />
47.0 44.9<br />
Flow rates<br />
66.6 66.5<br />
51.4 49.5 Muslim Enrolment<br />
Grade<br />
School category<br />
I<br />
P. only P + UP P+sec/hs U.P. only UP+Sec <strong>II</strong><br />
51.7 42.5 43.4 51.6 49.1 <strong>II</strong>I<br />
79 60 75 55 45 IV<br />
47 41 82 26 25 V 0.8<br />
2.2 3.9 0.0 39.3 0.0 I - V 0.7<br />
31.0 14.5 37.5 16.9 0.0 VI 0.5<br />
36.7 7.5 8.2 18.4 0.0 V<strong>II</strong> 0.8<br />
45.5 27.6 50.0 79.0 0.0 V<strong>II</strong>I 0.7<br />
Classrooms<br />
School category<br />
Total<br />
classrooms<br />
% Good<br />
condition<br />
% Minor<br />
repairs<br />
% Major<br />
repairs<br />
Other<br />
rooms<br />
Primary only<br />
6,834 75.9 19.8 4.3 1,862<br />
Primary with Upper Primary<br />
752 78.2 15.2 6.6 169<br />
Primary with U.P. Sec/Hr. Sec.<br />
56 69.6 28.6 1.8 17<br />
Upper Primary only<br />
2,753 83.5 13.8 2.7 793<br />
Upper Primary with Sec./H. Sec<br />
9 100.0 0.0 0.0<br />
0<br />
Position of teachers by educational qualification (Other than Contractual-teachers)<br />
School category<br />
Below<br />
Secondary Higher<br />
Secondary<br />
Secondary Graduate<br />
Primary only<br />
27 114 620 790<br />
Primary with Upper Primary<br />
1 21 134 236<br />
Primary with U. P. Sec/ Hr. Sec.<br />
0 3 28 28<br />
Upper Primary only<br />
30 58 266 576<br />
Upper Primary with Sec./Higher Secondary<br />
0 0 0 5<br />
Contractual-teachers<br />
Gender & caste distribution of teachers*<br />
School category Avg. No. of Tchs.<br />
Primary only<br />
2.8<br />
Primary with Upper Prim.<br />
6.8<br />
Prim.with U.P.Sec/Hr.Sec<br />
7.6<br />
Upper Primary only<br />
2.0<br />
U. Primary with Sec./Hr.S<br />
5.0<br />
Enrolment by medium of instructions*<br />
NER (Primary)<br />
GER(U.Prim)<br />
NER(U.Prim)<br />
Grade<br />
8.1 90.9 I<br />
7.6 91.8 <strong>II</strong><br />
10.7 88.6 <strong>II</strong>I<br />
11.7 87.8 IV<br />
40.1 59.1 V<br />
14.0 85.3 VI<br />
9.9 89.6 V<strong>II</strong><br />
6.2 93.0 V<strong>II</strong>I<br />
# # Total<br />
R.R. D.O.R. P.R.<br />
1.0<br />
0.6<br />
0.7<br />
0.5<br />
100.0<br />
123.0<br />
100.0<br />
No. of schools by type of building*<br />
Post<br />
No<br />
Graduate M. Phil. Others response<br />
100.0<br />
132.0<br />
100.0<br />
100.0<br />
46.3<br />
38.4<br />
Enrolment<br />
All With disability<br />
Girls Boys Girls<br />
36,788 142 88<br />
39,362 162 112<br />
37,667 188 169<br />
33,017 172 115<br />
28,479 134 101<br />
16,174 58 40<br />
13,642 39 43<br />
11,664 44 59<br />
216,793 939 727<br />
Pucca<br />
Partially<br />
Multiple No<br />
Pucca Kuchcha Tent Type Building<br />
1,365 13 1 1 62 5<br />
59 1 0 0 16 0<br />
7 1 0 0 0 0<br />
613 2 0 0 18 11<br />
1 0 0 0 0 0<br />
263 8 3<br />
126 0 0 0<br />
2 0 0 0<br />
351 5 0 0<br />
0 0 0 0<br />
11 32 939 812 393 12 0 0<br />
Total<br />
Regular teachers Contractual-teachers SC teachers ST teachers<br />
Male Female No res Male Female No res Male Female Male Female<br />
4024 1547 278 0 1000 1199 0 377 204 20 10<br />
518 479 39 0 0 0 0 72 4 0 0<br />
61 56 5 0 0 0 0 3 0 0 0<br />
1286 1050 236 0 0 0 0 200 30 15 9<br />
5 5 0 0 0 0 0 0 0 0 0<br />
% Total Primary Upper Primary % Schools recvd.<br />
Grossness<br />
(Previous year)<br />
7.8<br />
17.1<br />
School T L M<br />
dev. grant grant<br />
Examination results<br />
(Previous academic year)<br />
Terminal % % Passed<br />
0 grade Passed with >60%<br />
V boys 98.0 38.9<br />
V girls 97.9 32.8<br />
V<strong>II</strong>I boys 97.3 41.8<br />
V<strong>II</strong>I girls 97.8 37.2<br />
%Teachers recvd.<br />
In-service training<br />
Male Female<br />
50.8 75.1<br />
1.7 0.0<br />
0.0 0.0<br />
33.0 40.7<br />
0.0 0.0<br />
Incentives : Number of beneficiaries<br />
(Previous academic year)<br />
Category Hindi<br />
Urdu Others<br />
Incentive<br />
P. only<br />
312930<br />
4250<br />
2004<br />
81.1 78.9 Type<br />
P + UP<br />
25627<br />
5532<br />
34<br />
2.6 2.6 Text books<br />
P+sec/hs<br />
3733<br />
864<br />
0<br />
0.0 0.0 Uniform<br />
U.P. only 69664<br />
58<br />
915<br />
49.1 44.9 Attendance<br />
UP+Sec<br />
224<br />
0<br />
0<br />
0.0 0.0 Stationery<br />
# = not applicable na = not available * Some totals may not match due to no response in classificatory data items<br />
Primary Upper primary<br />
Boys Girls Boys Girls<br />
121213 136108 20948 23652<br />
2520 130057 233 846<br />
79945 90027 20347 19305<br />
1042 1481 334 551


