

Volume II - DISE
Volume II - DISE
Volume II - DISE

You also want an ePaper? Increase the reach of your titles
YUMPU automatically turns print PDFs into web optimized ePapers that Google loves.
Uttar Pradesh<br />
538<br />
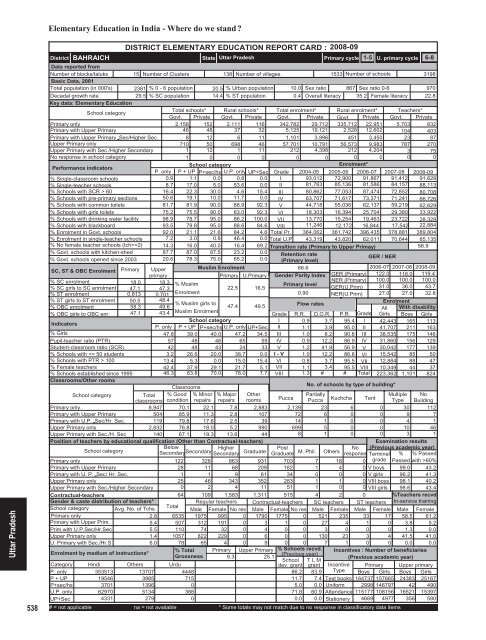
Elementary Education in India - Where do we stand <br />
District<br />
BAHRAICH<br />
DISTRICT ELEMENTARY EDUCATION REPORT CARD : 2008-09<br />
State Uttar Pradesh<br />
Primary cycle<br />
1-5 U. primary cycle 6-8<br />
Data reported from<br />
Number of blocks/taluks 15 Number of Clusters 138 Number of villages<br />
1533 Number of schools<br />
3198<br />
Basic Data, 2001<br />
Total population (in 000's) 2381 % 0 - 6 population 20.5 % Urban population 10.0 Sex ratio 867 Sex ratio 0-6<br />
970<br />
Decadal growth rate<br />
29.5 % SC population 14.4 % ST population<br />
0.4 Overall literacy 35.2 Female literacy 22.8<br />
Key data: Elementary Education<br />
School category<br />
Total schools* Rural schools* Total enrolment* Rural enrolment* Teachers*<br />
Govt. Private Govt. Private Govt. Private Govt. Private Govt. Private<br />
Primary only<br />
2,158 152 2,111 116 342,782 29,712 335,712 22,951 5,703 832<br />
Primary with Upper Primary<br />
46 48 37 32 5,125 19,121 2,528 12,602 104 403<br />
Primary with Upper Primary Sec/Higher Sec.<br />
8 12 6 11 1,101 3,996 451 3,450 23 87<br />
Upper Primary only<br />
710 50 698 46 57,701 10,791 56,573 9,983 787 270<br />
Upper Primary with Sec./Higher Secondary<br />
1 12 1 11 212 4,398 212 4,204 3 75<br />
No response in school category<br />
1 0 0 0 0 0 0 0 0 0<br />
Performance indicators<br />
School category<br />
Enrolment*<br />
P. only P + UP P+sec/hs U.P. only UP+Sec Grade 2004-05 2005-06 2006-07 2007-08 2008-09<br />
% Single-classroom schools<br />
0.9 1.1 0.0 0.8 0.0 I 93,012 72,900 91,867 91,412 91,628<br />
% Single-teacher schools<br />
8.7 17.0 5.0 53.6 0.0 <strong>II</strong> 81,763 85,136 81,586 84,157 88,113<br />
% Schools with SCR > 60<br />
16.4 22.3 30.0 4.6 15.4 <strong>II</strong>I 80,862 77,053 87,474 72,852 80,708<br />
% Schools with pre-primary sections 50.6 19.1 10.0 11.7 0.0 IV 63,707 71,617 73,371 71,241 66,726<br />
% Schools with common toilets 81.7 81.9 90.0 88.9 92.3 V 44,718 55,036 62,137 59,219 62,629<br />
% Schools with girls toilets 75.2 75.5 90.0 83.0 92.3 VI 18,303 16,394 25,704 29,380 33,922<br />
% Schools with drinking water facility 98.9 78.7 95.0 86.2 100.0 V<strong>II</strong> 13,770 15,254 19,463 23,722 28,329<br />
% Schools with blackboard<br />
93.5 79.8 95.0 88.6 84.6 V<strong>II</strong>I 11,246 12,172 16,844 17,542 22,884<br />
% Enrolment in Govt. schools 92.0 21.1 21.6 84.2 4.6 Total Pr. 364,062 361,742 396,435 378,881 389,804<br />
% Enrolment in single-teacher schools 7.2 3.0 0.8 46.4 0.0 Total U.P 43,319 43,820 62,011 70,644 85,135<br />
% No female teacher schools (tch>=2) 14.3 16.0 40.0 16.4 69.2 Transition rate (Primary to Upper Primay)<br />
56.9<br />
% Govt. schools with kitchen-shed 87.7 87.0 87.5 23.2 0.0 Retention rate<br />
% Govt. schools opened since 2003 20.6 78.3 75.0 65.2 0.0 (Primary level)<br />
/ NER<br />
GER<br />
SC, ST & OBC Enrolment Primary Upper<br />
Muslim Enrolment<br />
66.6<br />
2006-07 2007-08 2008-09<br />
primary<br />
Primary U.Primary Gender Parity Index GER (Primary) 122.0 116.0 119.4<br />
% SC enrolment<br />
% SC girls to SC enrolment<br />
% ST enrolment<br />
% ST girls to ST enrolment<br />
% OBC enrolment<br />
% OBC girls to OBC enr.<br />
Indicators<br />
% Girls<br />
Pupil-teacher ratio (PTR)<br />
Student-classroom ratio (SCR)<br />
% Schools with 100<br />
% Female teachers<br />
% Schools established since 1995<br />
Classrooms/Other rooms<br />
18.0 18.3 % Muslim<br />
Primary level<br />
47.1 47.3<br />
22.5 16.5<br />
0.813 0.701<br />
Enrolment<br />
0.90<br />
50.5 48.4<br />
% Muslim girls to<br />
47.4 49.5<br />
Flow rates<br />
58.3 49.6<br />
47.1 43.4 Muslim Enrolment<br />
Grade<br />
School category<br />
I<br />
P. only P + UP P+sec/hs U.P. only UP+Sec <strong>II</strong><br />
47.8 39.0 40.0 47.2 34.5 <strong>II</strong>I<br />
57 48 46 65 59 IV<br />
42 48 43 24 33 V 1.2<br />
3.2 26.6 20.0 38.7 0.0 I - V 1.0<br />
13.4 5.3 0.0 15.0 15.4 VI 0.8<br />
42.4 37.9 29.1 21.7 5.1 V<strong>II</strong> 1.1<br />
46.3 63.8 70.0 78.0 7.7 V<strong>II</strong>I 1.3<br />
Classrooms<br />
School category<br />
Total<br />
classrooms<br />
% Good<br />
condition<br />
% Minor<br />
repairs<br />
% Major<br />
repairs<br />
Other<br />
rooms<br />
Primary only<br />
8,947 70.1 22.1 7.8 2,883<br />
Primary with Upper Primary<br />
504 85.9 11.3 2.8 107<br />
Primary with U.P. Sec/Hr. Sec.<br />
119 79.8 17.6 2.5 39<br />
Upper Primary only<br />
2,832 76.8 18.0 5.2 990<br />
Upper Primary with Sec./H. Sec<br />
140 67.1 19.3 13.6 44<br />
Position of teachers by educational qualification (Other than Contractual-teachers)<br />
School category<br />
Below<br />
Secondary Higher<br />
Secondary<br />
Secondary Graduate<br />
Primary only<br />
122 326 863 931<br />
Primary with Upper Primary<br />
28 11 68 209<br />
Primary with U. P. Sec/ Hr. Sec.<br />
1 1 9 61<br />
Upper Primary only<br />
25 46 343 352<br />
Upper Primary with Sec./Higher Secondary<br />
0 2 4 11<br />
Contractual-teachers<br />
Gender & caste distribution of teachers*<br />
School category Avg. No. of Tchs.<br />
Primary only<br />
2.8<br />
Primary with Upper Prim.<br />
5.4<br />
Prim.with U.P.Sec/Hr.Sec<br />
5.5<br />
Upper Primary only<br />
1.4<br />
U. Primary with Sec./Hr.S<br />
6.0<br />
Enrolment by medium of instructions*<br />
NER (Primary)<br />
GER(U.Prim)<br />
NER(U.Prim)<br />
Grade<br />
3.7 95.4 I<br />
3.9 95.0 <strong>II</strong><br />
8.2 90.8 <strong>II</strong>I<br />
12.2 86.9 IV<br />
41.9 56.9 V<br />
12.2 86.8 VI<br />
3.7 95.5 V<strong>II</strong><br />
3.4 95.5 V<strong>II</strong>I<br />
# # Total<br />
R.R. D.O.R. P.R.<br />
0.9<br />
1.1<br />
1.0<br />
0.9<br />
100.0<br />
31.0<br />
27.0<br />
No. of schools by type of building*<br />
Post<br />
No<br />
Graduate M. Phil. Others response<br />
100.0<br />
36.0<br />
27.0<br />
100.0<br />
43.7<br />
32.8<br />
Enrolment<br />
All With disability<br />
Girls Boys Girls<br />
42,443 165 113<br />
41,707 211 163<br />
38,535 175 146<br />
31,860 156 129<br />
30,042 177 139<br />
15,542 85 50<br />
12,884 88 47<br />
10,349 44 37<br />
223,362 1,101 824<br />
Pucca<br />
Partially<br />
Multiple No<br />
Pucca Kuchcha Tent Type Building<br />
2,139 23 6 0 30 112<br />
72 6 0 0 9 7<br />
14 1 0 0 4 1<br />
699 5 0 0 10 46<br />
8 1 0 0 3 1<br />
703 7 18<br />
182 1 4 0<br />
34 0 0 0<br />
283 1 1 0<br />
51 1 0 0<br />
64 109 1,583 1,311 515 4 2 0<br />
Total<br />
Regular teachers Contractual-teachers SC teachers ST teachers<br />
Male Female No res Male Female No res Male Female Male Female<br />
6535 1975 995 0 1790 1775 0 521 235 33 17<br />
507 312 191 0 3 1 0 27 4 1 0<br />
110 74 32 0 4 0 0 3 0 0 0<br />
1057 822 229 0 6 0 0 130 23 3 4<br />
78 65 4 0 9 0 0 7 1 0 0<br />
% Total Primary Upper Primary % Schools recvd.<br />
Grossness<br />
(Previous year)<br />
9.3<br />
25.1<br />
School T L M<br />
dev. grant grant<br />
Examination results<br />
(Previous academic year)<br />
Terminal % % Passed<br />
0 grade Passed with >60%<br />
V boys 99.0 43.2<br />
V girls 96.2 41.3<br />
V<strong>II</strong>I boys 98.1 40.2<br />
V<strong>II</strong>I girls 98.6 43.4<br />
%Teachers recvd.<br />
In-service training<br />
Male Female<br />
58.5 61.2<br />
3.8 5.2<br />
1.3 0.0<br />
41.5 41.0<br />
0.0 0.0<br />
Incentives : Number of beneficiaries<br />
(Previous academic year)<br />
Category Hindi Others Urdu<br />
Incentive<br />
P. only<br />
353513 13707<br />
4448<br />
86.2 83.9 Type<br />
P + UP<br />
19546<br />
3985<br />
715<br />
11.7 7.4 Text books<br />
P+sec/hs<br />
3701<br />
1396<br />
0<br />
5.0 0.0 Uniform<br />
U.P. only 62970<br />
5134<br />
388<br />
71.8 60.9 Attendance<br />
UP+Sec<br />
4331<br />
279<br />
0<br />
0.0 0.0 Stationery<br />
# = not applicable na = not available * Some totals may not match due to no response in classificatory data items<br />
Primary Upper primary<br />
Boys Girls Boys Girls<br />
164737 157665 24383 25167<br />
2998 146797 42 490<br />
115177 108156 16521 15397<br />
4669 4977 356 580


