

Volume II - DISE
Volume II - DISE
Volume II - DISE

You also want an ePaper? Increase the reach of your titles
YUMPU automatically turns print PDFs into web optimized ePapers that Google loves.
District<br />
UNNAO<br />
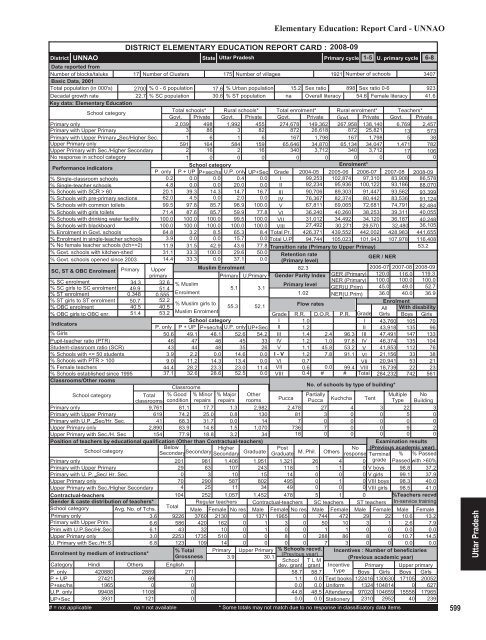
DISTRICT ELEMENTARY EDUCATION REPORT CARD : 2008-09<br />
State Uttar Pradesh<br />
Elementary Education: Report Card - UNNAO<br />
Primary cycle<br />
1-5 U. primary cycle 6-8<br />
Data reported from<br />
Number of blocks/taluks 17 Number of Clusters 175 Number of villages<br />
1921 Number of schools<br />
3407<br />
Basic Data, 2001<br />
Total population (in 000's) 2700 % 0 - 6 population 17.6 % Urban population 15.2 Sex ratio 898 Sex ratio 0-6<br />
923<br />
Decadal growth rate<br />
22.7 % SC population 30.6 % ST population na Overall literacy 54.6 Female literacy 41.6<br />
Key data: Elementary Education<br />
School category<br />
Total schools* Rural schools* Total enrolment* Rural enrolment* Teachers*<br />
Govt. Private Govt. Private Govt. Private Govt. Private Govt. Private<br />
Primary only<br />
2,039 498 1,992 455 274,678 149,362 267,958 138,140 6,769 2,457<br />
Primary with Upper Primary<br />
3 86 3 82 872 26,618 872 25,821 13 573<br />
Primary with Upper Primary Sec/Higher Sec.<br />
1 6 1 6 167 1,798 167 1,798 5 38<br />
Upper Primary only<br />
591 164 584 159 65,646 34,870 65,134 34,047 1,471 782<br />
Upper Primary with Sec./Higher Secondary<br />
2 16 2 16 340 3,712 340 3,712 17 106<br />
No response in school category<br />
1 0 0 0 0 0 0 0 0 0<br />
Performance indicators<br />
School category<br />
Enrolment*<br />
P. only P + UP P+sec/hs U.P. only UP+Sec Grade 2004-05 2005-06 2006-07 2007-08 2008-09<br />
% Single-classroom schools<br />
0.2 0.0 0.0 0.4 0.0 I 99,253 102,874 97,310 83,908 86,578<br />
% Single-teacher schools<br />
4.8 0.0 0.0 20.0 0.0 <strong>II</strong> 92,234 95,936 100,122 93,186 88,070<br />
% Schools with SCR > 60<br />
20.1 39.3 14.3 14.7 16.7 <strong>II</strong>I 90,706 89,303 91,447 93,562 93,399<br />
% Schools with pre-primary sections 62.0 4.5 0.0 2.0 0.0 IV 76,367 82,374 80,442 83,536 91,124<br />
% Schools with common toilets 99.5 97.8 85.7 98.9 100.0 V 67,811 69,065 72,681 74,791 82,484<br />
% Schools with girls toilets 71.4 87.6 85.7 59.9 77.8 VI 36,240 40,260 38,253 39,311 40,055<br />
% Schools with drinking water facility 100.0 100.0 100.0 99.5 100.0 V<strong>II</strong> 31,012 34,492 34,120 36,187 40,248<br />
% Schools with blackboard<br />
100.0 100.0 100.0 100.0 100.0 V<strong>II</strong>I 27,492 30,271 29,570 32,480 36,105<br />
% Enrolment in Govt. schools 64.8 3.2 8.5 65.3 8.4 Total Pr. 426,371 439,552 442,002 428,983 441,655<br />
% Enrolment in single-teacher schools 3.9 0.0 0.0 15.7 0.0 Total U.P 94,744 105,023 101,943 107,978 116,408<br />
% No female teacher schools (tch>=2) 11.9 31.5 42.9 43.6 77.8 Transition rate (Primary to Upper Primay)<br />
53.2<br />
% Govt. schools with kitchen-shed 31.1 33.3 100.0 29.6 50.0 Retention rate<br />
% Govt. schools opened since 2003 14.4 33.3 0.0 37.1 0.0 (Primary level)<br />
/ NER<br />
GER<br />
SC, ST & OBC Enrolment Primary Upper<br />
Muslim Enrolment<br />
82.3<br />
2006-07 2007-08 2008-09<br />
primary<br />
Primary U.Primary Gender Parity Index GER (Primary) 120.0 116.0 119.3<br />
% SC enrolment<br />
% SC girls to SC enrolment<br />
% ST enrolment<br />
% ST girls to ST enrolment<br />
% OBC enrolment<br />
% OBC girls to OBC enr.<br />
Indicators<br />
% Girls<br />
Pupil-teacher ratio (PTR)<br />
Student-classroom ratio (SCR)<br />
% Schools with 100<br />
% Female teachers<br />
% Schools established since 1995<br />
Classrooms/Other rooms<br />
34.3 32.6 % Muslim<br />
Primary level<br />
49.9 51.4<br />
5.1 3.1<br />
0.348 0.555<br />
Enrolment<br />
1.02<br />
50.7 52.2<br />
% Muslim girls to<br />
55.3 52.1<br />
Flow rates<br />
40.5 40.5<br />
51.4 53.2 Muslim Enrolment<br />
Grade<br />
School category<br />
I<br />
P. only P + UP P+sec/hs U.P. only UP+Sec <strong>II</strong><br />
50.6 49.1 48.1 52.6 54.2 <strong>II</strong>I<br />
46 47 46 45 33 IV<br />
43 44 48 35 26 V 1.1<br />
3.9 2.2 0.0 14.6 0.0 I - V 1.2<br />
9.0 11.2 14.3 13.4 0.0 VI 0.7<br />
44.4 28.2 23.3 23.0 11.4 V<strong>II</strong> 0.6<br />
37.1 32.6 28.6 52.5 0.0 V<strong>II</strong>I 0.4<br />
Classrooms<br />
School category<br />
Total<br />
classrooms<br />
% Good<br />
condition<br />
% Minor<br />
repairs<br />
% Major<br />
repairs<br />
Other<br />
rooms<br />
Primary only<br />
9,761 81.1 17.7 1.3 2,982<br />
Primary with Upper Primary<br />
619 74.2 25.0 0.8 130<br />
Primary with U.P. Sec/Hr. Sec.<br />
41 68.3 31.7 0.0 14<br />
Upper Primary only<br />
2,890 83.9 14.6 1.5 1,070<br />
Upper Primary with Sec./H. Sec<br />
154 77.9 18.8 3.2 34<br />
Position of teachers by educational qualification (Other than Contractual-teachers)<br />
School category<br />
Below<br />
Secondary Higher<br />
Secondary<br />
Secondary Graduate<br />
Primary only<br />
201 981 1,406 1,951<br />
Primary with Upper Primary<br />
29 83 107 243<br />
Primary with U. P. Sec/ Hr. Sec.<br />
0 3 10 15<br />
Upper Primary only<br />
70 290 587 802<br />
Upper Primary with Sec./Higher Secondary<br />
4 25 11 34<br />
Contractual-teachers<br />
Gender & caste distribution of teachers*<br />
School category Avg. No. of Tchs.<br />
Primary only<br />
3.6<br />
Primary with Upper Prim.<br />
6.6<br />
Prim.with U.P.Sec/Hr.Sec<br />
6.1<br />
Upper Primary only<br />
3.0<br />
U. Primary with Sec./Hr.S<br />
6.8<br />
Enrolment by medium of instructions*<br />
NER (Primary)<br />
GER(U.Prim)<br />
NER(U.Prim)<br />
Grade<br />
I<br />
<strong>II</strong><br />
2.4 96.3 <strong>II</strong>I<br />
1.0 97.8 IV<br />
45.8 53.2 V<br />
7.8 91.1 VI<br />
V<strong>II</strong><br />
0.0 99.4 V<strong>II</strong>I<br />
# # Total<br />
R.R. D.O.R. P.R.<br />
1.0<br />
1.2<br />
1.4<br />
1.2<br />
100.0<br />
45.0<br />
36.0<br />
No. of schools by type of building*<br />
Post<br />
No<br />
Graduate M. Phil. Others response<br />
100.0<br />
49.0<br />
40.0<br />
100.0<br />
52.7<br />
36.9<br />
Enrolment<br />
All With disability<br />
Girls Boys Girls<br />
43,760 105 70<br />
43,918 135 96<br />
47,491 147 133<br />
46,374 135 104<br />
41,853 112 76<br />
21,156 33 38<br />
20,941 53 21<br />
18,739 22 23<br />
284,232 742 561<br />
Pucca<br />
Partially<br />
Multiple No<br />
Pucca Kuchcha Tent Type Building<br />
2,478 27 4 3 22 3<br />
81 3 0 0 5 0<br />
7 0 0 0 0 0<br />
736 7 0 0 9 2<br />
18 0 0 0 0 0<br />
1,321 26 4<br />
118 1 1 0<br />
14 0 0 0<br />
495 0 1 0<br />
49 0 0 0<br />
104 252 1,057 1,452 478 5 1 0<br />
Total<br />
Regular teachers Contractual-teachers SC teachers ST teachers<br />
Male Female No res Male Female No res Male Female Male Female<br />
9226 3760 2130 0 1371 1965 0 744 472 29 22<br />
586 420 162 0 1 3 0 50 10 3 1<br />
43 32 10 0 1 0 0 1 1 0 0<br />
2253 1735 510 0 0 8 0 288 86 8 6<br />
123 109 14 0 0 0 0 7 3 0 0<br />
% Total Primary Upper Primary % Schools recvd.<br />
Grossness<br />
(Previous year)<br />
3.9<br />
30.1<br />
School T L M<br />
dev. grant grant<br />
Examination results<br />
(Previous academic year)<br />
Terminal % % Passed<br />
0 grade Passed with >60%<br />
V boys 98.8 37.2<br />
V girls 99.1 37.9<br />
V<strong>II</strong>I boys 98.3 40.0<br />
V<strong>II</strong>I girls 98.5 41.0<br />
%Teachers recvd.<br />
In-service training<br />
Male Female<br />
10.6 13.2<br />
2.6 7.9<br />
0.0 0.0<br />
10.7 14.5<br />
0.0 0.0<br />
Incentives : Number of beneficiaries<br />
(Previous academic year)<br />
Category Hindi Others English<br />
Incentive<br />
P. only<br />
420880<br />
2889<br />
271<br />
58.7 58.7 Type<br />
P + UP<br />
27421<br />
69<br />
0<br />
1.1 0.0 Text books<br />
P+sec/hs<br />
1965<br />
0<br />
0<br />
0.0 0.0 Uniform<br />
U.P. only 99408<br />
1108<br />
0<br />
44.8 48.5 Attendance<br />
UP+Sec<br />
3931<br />
121<br />
0<br />
0.0 0.0 Stationery<br />
# = not applicable na = not available * Some totals may not match due to no response in classificatory data items<br />
Primary Upper primary<br />
Boys Girls Boys Girls<br />
122416 130630 17105 20052<br />
1324 104814 0 627<br />
97020 104659 15558 17965<br />
2310 2952 40 239<br />
599<br />
Uttar Pradesh


