

Volume II - DISE
Volume II - DISE
Volume II - DISE

Create successful ePaper yourself
Turn your PDF publications into a flip-book with our unique Google optimized e-Paper software.
Punjab<br />
448<br />
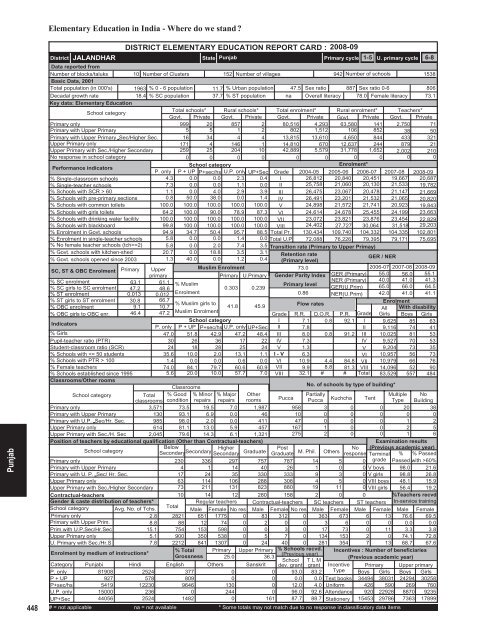
Elementary Education in India - Where do we stand <br />
District<br />
JALANDHAR<br />
DISTRICT ELEMENTARY EDUCATION REPORT CARD : 2008-09<br />
State Punjab<br />
Primary cycle<br />
1-5 U. primary cycle 6-8<br />
Data reported from<br />
Number of blocks/taluks 10 Number of Clusters 152 Number of villages<br />
942 Number of schools<br />
1538<br />
Basic Data, 2001<br />
Total population (in 000's) 1963 % 0 - 6 population 11.7 % Urban population 47.5 Sex ratio 887 Sex ratio 0-6<br />
806<br />
Decadal growth rate<br />
18.4 % SC population 37.7 % ST population na Overall literacy 78.0 Female literacy 73.1<br />
Key data: Elementary Education<br />
School category<br />
Total schools* Rural schools* Total enrolment* Rural enrolment* Teachers*<br />
Govt. Private Govt. Private Govt. Private Govt. Private Govt. Private<br />
Primary only<br />
999 20 857 2 80,516 4,293 63,580 141 2,750 71<br />
Primary with Upper Primary<br />
5 5 1 2 802 1,512 106 852 38 50<br />
Primary with Upper Primary Sec/Higher Sec. 16 34 4 4 13,815 13,610 4,650 844 433 321<br />
Upper Primary only<br />
171 4 146 1 14,810 670 12,637 244 879 21<br />
Upper Primary with Sec./Higher Secondary 259 25 204 10 42,889 5,579 31,778 1,652 2,002 210<br />
No response in school category<br />
0 0 0 0 0 0 0 0 0 0<br />
Performance indicators<br />
School category<br />
Enrolment*<br />
P. only P + UP P+sec/hs U.P. only UP+Sec Grade 2004-05 2005-06 2006-07 2007-08 2008-09<br />
% Single-classroom schools<br />
4.3 0.0 0.0 2.3 0.4 I 26,812 20,840 20,451 19,667 20,687<br />
% Single-teacher schools<br />
7.3 0.0 0.0 1.1 0.0 <strong>II</strong> 25,758 21,060 20,130 21,533 19,782<br />
% Schools with SCR > 60<br />
1.1 0.0 4.0 2.9 3.9 <strong>II</strong>I 26,475 23,067 20,478 21,147 21,669<br />
% Schools with pre-primary sections 0.8 50.0 38.0 0.0 1.4 IV 26,491 23,201 21,532 21,065 20,820<br />
% Schools with common toilets 100.0 100.0 100.0 100.0 100.0 V 24,898 21,572 21,741 20,923 19,843<br />
% Schools with girls toilets 64.2 100.0 90.0 78.9 87.3 VI 24,614 24,678 25,455 24,199 23,663<br />
% Schools with drinking water facility 100.0 100.0 100.0 100.0 100.0 V<strong>II</strong> 23,072 23,821 23,876 23,454 22,829<br />
% Schools with blackboard<br />
99.8 100.0 100.0 100.0 100.0 V<strong>II</strong>I 24,402 27,727 30,064 31,518 29,203<br />
% Enrolment in Govt. schools 94.9 34.7 50.4 95.7 88.5 Total Pr. 130,434 109,740 104,332 104,335 102,801<br />
% Enrolment in single-teacher schools 5.8 0.0 0.0 1.4 0.0 Total U.P 72,088 76,226 79,395 79,171 75,695<br />
% No female teacher schools (tch>=2) 5.8 0.0 2.0 7.4 3.5 Transition rate (Primary to Upper Primay)<br />
% Govt. schools with kitchen-shed 20.7 0.0 18.8 3.5 3.1 Retention rate<br />
% Govt. schools opened since 2003 1.3 40.0 0.0 1.2 0.4 (Primary level)<br />
/ NER<br />
GER<br />
SC, ST & OBC Enrolment Primary Upper<br />
Muslim Enrolment<br />
73.0<br />
2006-07 2007-08 2008-09<br />
primary<br />
Primary U.Primary Gender Parity Index GER (Primary) 55.0 56.0 55.1<br />
% SC enrolment<br />
% SC girls to SC enrolment<br />
% ST enrolment<br />
% ST girls to ST enrolment<br />
% OBC enrolment<br />
% OBC girls to OBC enr.<br />
Indicators<br />
% Girls<br />
Pupil-teacher ratio (PTR)<br />
Student-classroom ratio (SCR)<br />
% Schools with 100<br />
% Female teachers<br />
% Schools established since 1995<br />
Classrooms/Other rooms<br />
63.1 61.1<br />
NER (Primary)<br />
% Muslim<br />
Primary level<br />
47.2 48.6<br />
0.303 0.239<br />
GER(U.Prim)<br />
0.013 0.012<br />
Enrolment<br />
0.86 NER(U.Prim)<br />
30.8 66.7<br />
% Muslim girls to<br />
41.8 45.9<br />
Flow rates<br />
9.1 10.7<br />
46.4 47.2 Muslim Enrolment<br />
Grade R.R. D.O.R. P.R. Grade<br />
School category<br />
I 7.1 0.8 92.1 I<br />
P. only P + UP P+sec/hs U.P. only UP+Sec <strong>II</strong> 7.8<br />
<strong>II</strong><br />
47.0 51.8 42.9 47.2 48.4 <strong>II</strong>I 8.0 0.8 91.2 <strong>II</strong>I<br />
30 26 36 17 22 IV 7.3<br />
IV<br />
24 18 28 25 24 V 1.3<br />
V<br />
35.6 10.0 2.0 13.1 1.1 I - V 6.3<br />
VI<br />
1.4 0.0 0.0 0.6 0.0 VI 10.9 4.4 84.8 V<strong>II</strong><br />
74.0 84.1 79.7 60.6 60.9 V<strong>II</strong> 9.9 8.8 81.3 V<strong>II</strong>I<br />
5.6 20.0 10.0 57.7 7.0 V<strong>II</strong>I 32.1 # # Total<br />
Classrooms<br />
School category<br />
Total<br />
classrooms<br />
% Good<br />
condition<br />
% Minor<br />
repairs<br />
% Major<br />
repairs<br />
Other<br />
rooms<br />
Primary only<br />
3,571 73.5 19.5 7.0 1,987<br />
Primary with Upper Primary<br />
130 93.1 6.9 0.0 46<br />
Primary with U.P. Sec/Hr. Sec.<br />
985 98.0 2.0 0.0 411<br />
Upper Primary only<br />
614 81.1 13.0 5.9 457<br />
Upper Primary with Sec./H. Sec 2,045 79.6 14.3 6.1 1,321<br />
Position of teachers by educational qualification (Other than Contractual-teachers)<br />
School category<br />
Below<br />
Secondary Higher<br />
Secondary<br />
Secondary Graduate<br />
Primary only<br />
230 336 297 757<br />
Primary with Upper Primary<br />
4 1 14 40<br />
Primary with U. P. Sec/ Hr. Sec.<br />
17 24 35 330<br />
Upper Primary only<br />
63 114 106 288<br />
Upper Primary with Sec./Higher Secondary 73 211 131 823<br />
Contractual-teachers<br />
Gender & caste distribution of teachers*<br />
School category Avg. No. of Tchs.<br />
Primary only<br />
2.8<br />
Primary with Upper Prim.<br />
8.8<br />
Prim.with U.P.Sec/Hr.Sec<br />
15.1<br />
Upper Primary only<br />
5.1<br />
U. Primary with Sec./Hr.S<br />
7.8<br />
Enrolment by medium of instructions*<br />
40.0<br />
65.0<br />
42.0<br />
No. of schools by type of building*<br />
Post<br />
No<br />
Graduate M. Phil. Others response<br />
41.0<br />
66.0<br />
41.0<br />
41.3<br />
64.5<br />
41.1<br />
Enrolment<br />
All With disability<br />
Girls Boys Girls<br />
9,625 85 63<br />
9,116 74 41<br />
10,025 81 53<br />
9,527 70 53<br />
9,204 73 35<br />
10,957 56 73<br />
10,979 66 76<br />
14,096 52 90<br />
83,529 557 484<br />
Pucca<br />
Partially<br />
Multiple No<br />
Pucca Kuchcha Tent Type Building<br />
958 3 0 0 20 38<br />
10 0 0 0 0 0<br />
47 0 0 0 1 2<br />
167 1 0 0 2 5<br />
275 2 0 0 1 6<br />
787 14 5<br />
26 1 0 0<br />
333 9 3 0<br />
308 4 5 0<br />
880 19 11 0<br />
10 14 12 280 158 2 0 0<br />
Total<br />
Regular teachers Contractual-teachers SC teachers ST teachers<br />
Male Female No res Male Female No res Male Female Male Female<br />
2821 651 1775 0 83 312 0 363 673 6 13<br />
88 12 74 0 2 0 0 3 6 0 0<br />
754 153 598 0 0 3 0 17 73 0 11<br />
900 350 538 0 5 7 0 134 153 2 0<br />
2212 841 1307 0 24 40 0 281 354 7 13<br />
% Total Primary Upper Primary % Schools recvd.<br />
Grossness<br />
(Previous year)<br />
25.0<br />
36.3<br />
School T L M<br />
English Others Sanskrit dev. grant grant<br />
Examination results<br />
(Previous academic year)<br />
Terminal % % Passed<br />
0 grade Passed with >60%<br />
V boys 98.0 21.6<br />
V girls 98.8 26.8<br />
V<strong>II</strong>I boys 48.1 15.9<br />
V<strong>II</strong>I girls 56.4 19.2<br />
%Teachers recvd.<br />
In-service training<br />
Male Female<br />
76.6 69.5<br />
0.0 0.0<br />
3.3 3.8<br />
74.1 72.8<br />
68.7 67.6<br />
Incentives : Number of beneficiaries<br />
(Previous academic year)<br />
Category Punjabi Hindi<br />
Incentive<br />
P. only<br />
81908<br />
2524<br />
377<br />
0<br />
0 93.0 83.2 Type<br />
P + UP<br />
927<br />
578<br />
809<br />
0<br />
0 0.0 0.0 Text books<br />
P+sec/hs<br />
5419 12230<br />
9646<br />
130<br />
0 12.0 4.0 Uniform<br />
U.P. only 15000<br />
236<br />
0<br />
244<br />
0 96.0 92.6 Attendance<br />
UP+Sec<br />
44056<br />
2524<br />
1482<br />
0<br />
161 87.7 88.7 Stationery<br />
# = not applicable na = not available * Some totals may not match due to no response in classificatory data items<br />
Primary Upper primary<br />
Boys Girls Boys Girls<br />
34494 38031 24294 30258<br />
426 590 269 760<br />
920 22928 8870 9235<br />
15453 29786 7363 17899


