

Volume II - DISE
Volume II - DISE
Volume II - DISE

You also want an ePaper? Increase the reach of your titles
YUMPU automatically turns print PDFs into web optimized ePapers that Google loves.
District<br />
PUDUKKOTTAI<br />
State Tamil Nadu<br />
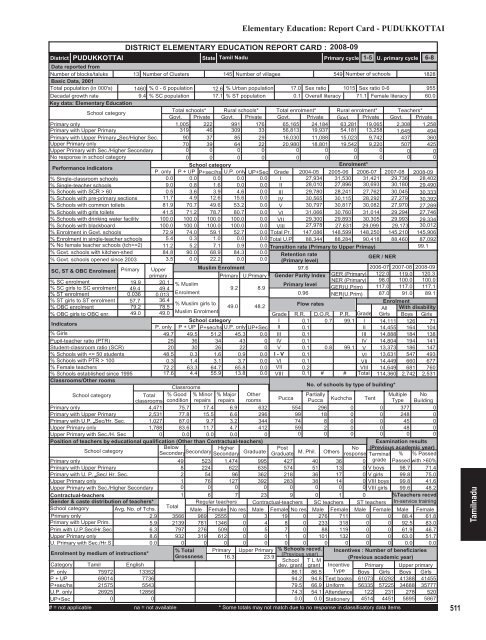
Elementary Education: Report Card - PUDUKKOTTAI<br />
DISTRICT ELEMENTARY EDUCATION REPORT CARD : 2008-09<br />
Primary cycle<br />
1-5 U. primary cycle 6-8<br />
Data reported from<br />
Number of blocks/taluks 13 Number of Clusters 145 Number of villages<br />
549 Number of schools<br />
1828<br />
Basic Data, 2001<br />
Total population (in 000's) 1460 % 0 - 6 population 12.6 % Urban population 17.0 Sex ratio 1015 Sex ratio 0-6<br />
955<br />
Decadal growth rate<br />
9.4 % SC population 17.1 % ST population<br />
0.1 Overall literacy 71.1 Female literacy 60.0<br />
Key data: Elementary Education<br />
School category<br />
Total schools* Rural schools* Total enrolment* Rural enrolment* Teachers*<br />
Govt. Private Govt. Private Govt. Private Govt. Private Govt. Private<br />
Primary only<br />
1,005 222 991 176 65,165 24,184 63,281 19,065 2,308 1,258<br />
Primary with Upper Primary<br />
319 46 309 33 56,813 19,937 54,181 13,258 1,645 494<br />
Primary with Upper Primary Sec/Higher Sec. 90 37 85 29 16,030 11,088 15,023 9,742 437 360<br />
Upper Primary only<br />
70 39 64 22 20,980 18,801 19,542 9,220 507 425<br />
Upper Primary with Sec./Higher Secondary<br />
0 0 0 0 0 0 0 0 0 0<br />
No response in school category<br />
0 0 0 0 0 0 0 0 0 0<br />
Performance indicators<br />
School category<br />
Enrolment*<br />
P. only P + UP P+sec/hs U.P. only UP+Sec Grade 2004-05 2005-06 2006-07 2007-08 2008-09<br />
% Single-classroom schools<br />
0.0 0.0 0.0 0.0 0.0 I 27,934 31,530 31,421 29,736 28,402<br />
% Single-teacher schools<br />
9.0 0.8 1.6 0.0 0.0 <strong>II</strong> 28,010 27,896 30,693 30,180 29,490<br />
% Schools with SCR > 60<br />
0.5 3.6 3.9 4.6 0.0 <strong>II</strong>I 29,780 28,241 27,762 30,045 30,333<br />
% Schools with pre-primary sections 11.7 4.9 12.6 15.6 0.0 IV 30,565 30,115 28,292 27,279 30,392<br />
% Schools with common toilets 81.9 70.7 49.6 53.2 0.0 V 30,797 30,817 30,082 27,970 27,289<br />
% Schools with girls toilets 41.5 71.2 78.7 80.7 0.0 VI 31,066 30,760 31,014 29,294 27,746<br />
% Schools with drinking water facility 100.0 100.0 100.0 100.0 0.0 V<strong>II</strong> 29,300 29,893 30,305 29,993 29,334<br />
% Schools with blackboard<br />
100.0 100.0 100.0 100.0 0.0 V<strong>II</strong>I 27,978 27,631 29,099 29,173 30,012<br />
% Enrolment in Govt. schools 72.9 74.0 59.1 52.7 0.0 Total Pr. 147,086 148,599 148,250 145,210 145,906<br />
% Enrolment in single-teacher schools 5.4 0.3 1.0 0.0 0.0 Total U.P 88,344 88,284 90,418 88,460 87,092<br />
% No female teacher schools (tch>=2) 11.2 5.2 7.1 0.9 0.0 Transition rate (Primary to Upper Primay)<br />
99.1<br />
% Govt. schools with kitchen-shed 84.8 90.0 68.9 84.3 0.0 Retention rate<br />
% Govt. schools opened since 2003 3.5 0.0 22.2 0.0 0.0 (Primary level)<br />
/ NER<br />
GER<br />
SC, ST & OBC Enrolment Primary Upper<br />
Muslim Enrolment<br />
97.6<br />
2006-07 2007-08 2008-09<br />
primary<br />
Primary U.Primary Gender Parity Index GER (Primary) 122.0 119.0 120.3<br />
% SC enrolment<br />
% SC girls to SC enrolment<br />
% ST enrolment<br />
% ST girls to ST enrolment<br />
% OBC enrolment<br />
% OBC girls to OBC enr.<br />
Indicators<br />
% Girls<br />
Pupil-teacher ratio (PTR)<br />
Student-classroom ratio (SCR)<br />
% Schools with 100<br />
% Female teachers<br />
% Schools established since 1995<br />
Classrooms/Other rooms<br />
19.9 20.1<br />
NER (Primary) 98.0<br />
% Muslim<br />
Primary level<br />
49.4 49.4<br />
9.2 8.9<br />
GER(U.Prim) 117.0<br />
0.036 0.013<br />
Enrolment<br />
0.96 NER(U.Prim) 87.0<br />
57.7 36.4<br />
% Muslim girls to<br />
49.0 48.2<br />
Flow rates<br />
79.2 78.5<br />
49.0 49.0 Muslim Enrolment<br />
Grade R.R. D.O.R. P.R. Grade<br />
School category<br />
I 0.1 0.7 99.1 I<br />
P. only P + UP P+sec/hs U.P. only UP+Sec <strong>II</strong> 0.1<br />
<strong>II</strong><br />
49.7 49.5 51.2 45.3 0.0 <strong>II</strong>I 0.1<br />
<strong>II</strong>I<br />
25 36 34 43 0 IV 0.1<br />
IV<br />
20 30 26 22 0 V 0.1 0.8 99.1 V<br />
48.5 0.3 1.6 0.9 0.0 I - V 0.1<br />
VI<br />
0.3 1.4 3.1 3.7 0.0 VI 0.1<br />
V<strong>II</strong><br />
72.2 63.3 64.7 65.8 0.0 V<strong>II</strong> 0.2<br />
V<strong>II</strong>I<br />
17.6 4.4 55.9 13.8 0.0 V<strong>II</strong>I 0.1 # # Total<br />
Classrooms<br />
School category<br />
Total<br />
classrooms<br />
% Good<br />
condition<br />
% Minor<br />
repairs<br />
% Major<br />
repairs<br />
Other<br />
rooms<br />
Primary only<br />
4,471 75.7 17.4 6.9 632<br />
Primary with Upper Primary<br />
2,531 77.8 15.5 6.6 296<br />
Primary with U.P. Sec/Hr. Sec. 1,027 87.0 9.7 3.2 344<br />
Upper Primary only<br />
1,788 83.6 11.7 4.7 412<br />
Upper Primary with Sec./H. Sec<br />
0 0.0 0.0 0.0<br />
0<br />
Position of teachers by educational qualification (Other than Contractual-teachers)<br />
School category<br />
Below<br />
Secondary Higher<br />
Secondary<br />
Secondary Graduate<br />
Primary only<br />
49 523 1,474 995<br />
Primary with Upper Primary<br />
8 224 622 635<br />
Primary with U. P. Sec/ Hr. Sec.<br />
2 54 96 362<br />
Upper Primary only<br />
1 76 127 392<br />
Upper Primary with Sec./Higher Secondary<br />
0 0 0 0<br />
Contractual-teachers<br />
Gender & caste distribution of teachers*<br />
School category Avg. No. of Tchs.<br />
Primary only<br />
2.9<br />
Primary with Upper Prim.<br />
5.9<br />
Prim.with U.P.Sec/Hr.Sec<br />
6.3<br />
Upper Primary only<br />
8.6<br />
U. Primary with Sec./Hr.S<br />
0.0<br />
Enrolment by medium of instructions*<br />
No. of schools by type of building*<br />
Post<br />
No<br />
Graduate M. Phil. Others response<br />
100.0<br />
117.0<br />
91.0<br />
100.0<br />
117.1<br />
89.1<br />
Enrolment<br />
All With disability<br />
Girls Boys Girls<br />
14,111 126 71<br />
14,455 164 104<br />
14,888 184 138<br />
14,804 194 141<br />
13,373 186 147<br />
13,631 547 493<br />
14,449 660 677<br />
14,649 681 760<br />
114,360 2,742 2,531<br />
Pucca<br />
Partially<br />
Multiple No<br />
Pucca Kuchcha Tent Type Building<br />
554 296 0 0 377 0<br />
99 18 0 0 248 0<br />
74 8 0 0 45 0<br />
59 2 0 0 48 0<br />
0 0 0 0 0 0<br />
427 40 36<br />
574 51 13 0<br />
218 36 17 0<br />
283 38 14 0<br />
0 0 0 0<br />
1 6 7 23 9 0 1 0<br />
Total<br />
Regular teachers Contractual-teachers SC teachers ST teachers<br />
Male Female No res Male Female No res Male Female Male Female<br />
3566 989 2555 0 3 19 0 276 711 0 0<br />
2139 781 1346 0 4 8 0 233 318 0 0<br />
797 276 509 0 5 7 0 88 119 0 0<br />
932 319 612 0 0 1 0 101 132 0 0<br />
0 0 0 0 0 0 0 0 0 0 0<br />
% Total Primary Upper Primary % Schools recvd.<br />
Grossness<br />
(Previous year)<br />
16.3<br />
23.9<br />
School T L M<br />
dev. grant grant<br />
Examination results<br />
(Previous academic year)<br />
Terminal % % Passed<br />
0 grade Passed with >60%<br />
V boys 98.7 71.4<br />
V girls 99.8 75.0<br />
V<strong>II</strong>I boys 99.8 41.6<br />
V<strong>II</strong>I girls 99.6 48.2<br />
%Teachers recvd.<br />
In-service training<br />
Male Female<br />
88.4 61.8<br />
92.5 83.0<br />
61.9 46.7<br />
63.0 51.7<br />
0.0 0.0<br />
Incentives : Number of beneficiaries<br />
(Previous academic year)<br />
Category<br />
P. only<br />
Tamil<br />
75972<br />
English<br />
13352<br />
86.1 86.5<br />
Incentive<br />
Type<br />
P + UP<br />
69014<br />
7736<br />
94.2 94.8 Text books<br />
P+sec/hs 21575<br />
5543<br />
79.5 66.9 Uniform<br />
U.P. only 26925 12856<br />
74.3 54.1 Attendance<br />
UP+Sec<br />
0<br />
0<br />
0.0 0.0 Stationery<br />
# = not applicable na = not available * Some totals may not match due to no response in classificatory data items<br />
Primary Upper primary<br />
Boys Girls Boys Girls<br />
61073 60292 41388 41455<br />
56335 57225 34688 35777<br />
122 231 278 520<br />
4514 4451 5895 5867<br />
511<br />
Tamilnadu


