

Volume II - DISE
Volume II - DISE
Volume II - DISE

You also want an ePaper? Increase the reach of your titles
YUMPU automatically turns print PDFs into web optimized ePapers that Google loves.
Uttar Pradesh<br />
564<br />
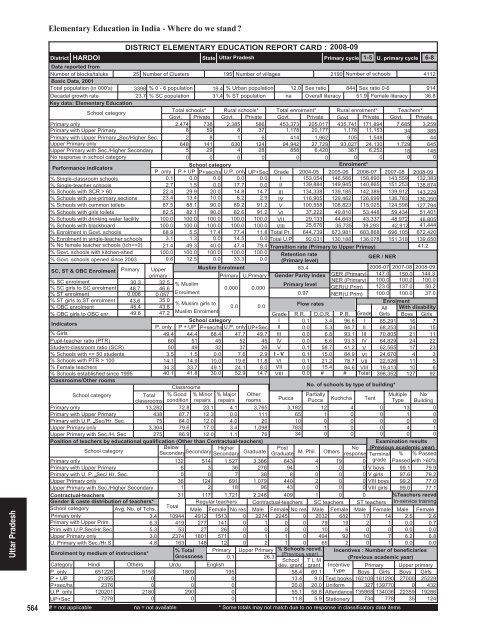
Elementary Education in India - Where do we stand <br />
District<br />
HARDOI<br />
DISTRICT ELEMENTARY EDUCATION REPORT CARD : 2008-09<br />
State Uttar Pradesh<br />
Primary cycle<br />
1-5 U. primary cycle 6-8<br />
Data reported from<br />
Number of blocks/taluks 25 Number of Clusters 195 Number of villages<br />
2190 Number of schools<br />
4112<br />
Basic Data, 2001<br />
Total population (in 000's) 3398 % 0 - 6 population 19.4 % Urban population 12.0 Sex ratio 844 Sex ratio 0-6<br />
914<br />
Decadal growth rate<br />
23.7 % SC population 31.4 % ST population na Overall literacy 51.9 Female literacy 36.8<br />
Key data: Elementary Education<br />
School category<br />
Total schools* Rural schools* Total enrolment* Rural enrolment* Teachers*<br />
Govt. Private Govt. Private Govt. Private Govt. Private Govt. Private<br />
Primary only<br />
2,474 738 2,385 586 453,373 205,017 435,741 171,894 7,685 3,259<br />
Primary with Upper Primary<br />
8 59 8 37 1,178 20,177 1,178 11,153 34 385<br />
Primary with Upper Primary Sec/Higher Sec.<br />
2 8 1 6 414 1,962 105 1,548 9 44<br />
Upper Primary only<br />
648 141 630 124 94,942 27,729 93,027 24,130 1,729 645<br />
Upper Primary with Sec./Higher Secondary<br />
5 29 4 28 858 6,420 367 6,252 18 145<br />
No response in school category<br />
0 0 0 0 0 0 0 0 0 0<br />
Performance indicators<br />
School category<br />
Enrolment*<br />
P. only P + UP P+sec/hs U.P. only UP+Sec Grade 2004-05 2005-06 2006-07 2007-08 2008-09<br />
% Single-classroom schools<br />
0.1 0.0 0.0 0.0 0.0 I 153,054 146,566 158,890 143,559 132,383<br />
% Single-teacher schools<br />
2.7 1.5 0.0 17.7 0.0 <strong>II</strong> 139,884 149,945 140,865 151,253 138,674<br />
% Schools with SCR > 60<br />
22.4 29.9 20.0 14.8 14.7 <strong>II</strong>I 134,338 139,185 142,389 139,912 143,229<br />
% Schools with pre-primary sections 23.4 13.4 10.0 6.2 2.9 IV 116,905 129,462 126,699 136,783 130,350<br />
% Schools with common toilets 87.5 88.1 90.0 89.2 91.2 V 100,558 108,823 115,025 124,598 127,784<br />
% Schools with girls toilets 82.5 82.1 90.0 82.6 91.2 VI 37,222 49,810 53,448 59,434 51,401<br />
% Schools with drinking water facility 100.0 100.0 100.0 100.0 100.0 V<strong>II</strong> 29,133 44,643 43,337 48,972 46,805<br />
% Schools with blackboard<br />
100.0 100.0 100.0 100.0 100.0 V<strong>II</strong>I 25,676 35,735 39,293 42,912 41,444<br />
% Enrolment in Govt. schools 68.9 5.5 17.4 77.4 11.8 Total Pr. 644,739 673,981 683,868 696,105 672,420<br />
% Enrolment in single-teacher schools 3.1 1.3 0.0 14.5 0.0 Total U.P 92,031 130,188 136,078 151,318 139,650<br />
% No female teacher schools (tch>=2) 21.4 49.3 40.0 47.4 79.4 Transition rate (Primary to Upper Primay)<br />
41.2<br />
% Govt. schools with kitchen-shed 100.0 100.0 100.0 100.0 100.0 Retention rate<br />
% Govt. schools opened since 2003 9.6 12.5 0.0 33.3 0.0 (Primary level)<br />
/ NER<br />
GER<br />
SC, ST & OBC Enrolment Primary Upper<br />
Muslim Enrolment<br />
83.4<br />
2006-07 2007-08 2008-09<br />
primary<br />
Primary U.Primary Gender Parity Index GER (Primary) 147.0 150.0 144.3<br />
% SC enrolment<br />
% SC girls to SC enrolment<br />
% ST enrolment<br />
% ST girls to ST enrolment<br />
% OBC enrolment<br />
% OBC girls to OBC enr.<br />
Indicators<br />
% Girls<br />
Pupil-teacher ratio (PTR)<br />
Student-classroom ratio (SCR)<br />
% Schools with 100<br />
% Female teachers<br />
% Schools established since 1995<br />
Classrooms/Other rooms<br />
30.3 32.5 % Muslim<br />
Primary level<br />
48.7 46.6<br />
0.000 0.000<br />
0.006 0.057<br />
Enrolment<br />
0.97<br />
43.6 35.0<br />
% Muslim girls to<br />
0.0 0.0<br />
Flow rates<br />
45.4 43.8<br />
49.6 47.2 Muslim Enrolment<br />
Grade<br />
School category<br />
I<br />
P. only P + UP P+sec/hs U.P. only UP+Sec <strong>II</strong><br />
49.4 44.4 68.4 47.7 49.7 <strong>II</strong>I<br />
60 51 45 52 45 IV<br />
50 49 32 37 26 V 0.1<br />
3.5 1.5 0.0 7.6 2.9 I - V 0.1<br />
14.1 14.9 10.0 19.6 11.8 VI 0.1<br />
34.3 33.7 49.1 24.1 8.0 V<strong>II</strong> 0.0<br />
40.1 41.8 30.0 52.9 14.7 V<strong>II</strong>I 0.0<br />
Classrooms<br />
School category<br />
Total<br />
classrooms<br />
% Good<br />
condition<br />
% Minor<br />
repairs<br />
% Major<br />
repairs<br />
Other<br />
rooms<br />
Primary only<br />
13,282 72.8 23.1 4.1 3,765<br />
Primary with Upper Primary<br />
438 87.7 12.3 0.0 111<br />
Primary with U.P. Sec/Hr. Sec.<br />
75 84.0 12.0 4.0 20<br />
Upper Primary only<br />
3,304 79.6 17.0 3.4 1,098<br />
Upper Primary with Sec./H. Sec<br />
275 86.9 12.0 1.1 76<br />
Position of teachers by educational qualification (Other than Contractual-teachers)<br />
School category<br />
Below<br />
Secondary Higher<br />
Secondary<br />
Secondary Graduate<br />
Primary only<br />
132 514 1,527 3,386<br />
Primary with Upper Primary<br />
6 3 36 278<br />
Primary with U. P. Sec/ Hr. Sec.<br />
0 0 7 38<br />
Upper Primary only<br />
36 124 691 1,079<br />
Upper Primary with Sec./Higher Secondary<br />
1 2 18 96<br />
Contractual-teachers<br />
Gender & caste distribution of teachers*<br />
School category Avg. No. of Tchs.<br />
Primary only<br />
3.4<br />
Primary with Upper Prim.<br />
6.3<br />
Prim.with U.P.Sec/Hr.Sec<br />
5.3<br />
Upper Primary only<br />
3.0<br />
U. Primary with Sec./Hr.S<br />
4.8<br />
Enrolment by medium of instructions*<br />
NER (Primary)<br />
GER(U.Prim)<br />
NER(U.Prim)<br />
Grade<br />
3.4 96.6 I<br />
5.3 94.7 <strong>II</strong><br />
6.8 93.1 <strong>II</strong>I<br />
6.6 93.3 IV<br />
58.7 41.2 V<br />
15.0 84.9 VI<br />
21.2 78.7 V<strong>II</strong><br />
15.4 84.6 V<strong>II</strong>I<br />
# # Total<br />
R.R. D.O.R. P.R.<br />
0.1<br />
0.0<br />
0.0<br />
0.0<br />
100.0<br />
123.0<br />
100.0<br />
No. of schools by type of building*<br />
Post<br />
No<br />
Graduate M. Phil. Others response<br />
100.0<br />
137.0<br />
100.0<br />
100.0<br />
50.2<br />
37.0<br />
Enrolment<br />
All With disability<br />
Girls Boys Girls<br />
65,291 16 7<br />
68,253 24 15<br />
70,805 21 11<br />
64,829 24 22<br />
62,565 17 23<br />
24,670 4 3<br />
22,526 11 5<br />
19,413 10 6<br />
398,352 127 92<br />
Pucca<br />
Partially<br />
Multiple No<br />
Pucca Kuchcha Tent Type Building<br />
3,182 12 4 0 13 0<br />
65 1 0 0 1 0<br />
10 0 0 0 0 0<br />
783 1 0 0 4 1<br />
34 0 0 0 0 0<br />
843 4 19<br />
94 1 0 0<br />
8 0 0 0<br />
440 2 0 0<br />
43 0 0 0<br />
31 117 1,721 2,246 409 1 0 0<br />
Total<br />
Regular teachers Contractual-teachers SC teachers ST teachers<br />
Male Female No res Male Female No res Male Female Male Female<br />
10944 4912 1513 0 2274 2245 0 2032 682 17 14<br />
419 277 141 0 1 0 0 79 19 2 1<br />
53 27 26 0 0 0 0 10 6 0 0<br />
2374 1801 571 0 1 1 0 494 92 10 7<br />
163 148 12 0 2 1 0 65 2 0 1<br />
% Total Primary Upper Primary % Schools recvd.<br />
Grossness<br />
(Previous year)<br />
0.1<br />
26.3<br />
School T L M<br />
Urdu English<br />
dev. grant grant<br />
Examination results<br />
(Previous academic year)<br />
Terminal % % Passed<br />
0 grade Passed with >60%<br />
V boys 99.1 79.9<br />
V girls 97.6 79.2<br />
V<strong>II</strong>I boys 99.2 77.0<br />
V<strong>II</strong>I girls 99.0 77.1<br />
%Teachers recvd.<br />
In-service training<br />
Male Female<br />
2.5 2.6<br />
0.0 0.7<br />
0.0 0.0<br />
6.2 6.8<br />
0.0 0.0<br />
Incentives : Number of beneficiaries<br />
(Previous academic year)<br />
Category<br />
P. only<br />
Hindi<br />
651228<br />
Others<br />
5158<br />
1809<br />
195<br />
58.4 60.1<br />
Incentive<br />
Type<br />
P + UP<br />
21355<br />
0<br />
0<br />
0<br />
13.4 9.0 Text books<br />
P+sec/hs<br />
2376<br />
0<br />
0<br />
0<br />
20.0 20.0 Uniform<br />
U.P. only 120201<br />
2180<br />
290<br />
0<br />
55.1 58.8 Attendance<br />
UP+Sec<br />
7278<br />
0<br />
0<br />
0<br />
11.8 5.9 Stationery<br />
# = not applicable na = not available * Some totals may not match due to no response in classificatory data items<br />
Primary Upper primary<br />
Boys Girls Boys Girls<br />
162108 161290 27000 25229<br />
327 139770 0 432<br />
135868 134036 22359 19286<br />
734 778 35 124


