

Volume II - DISE
Volume II - DISE
Volume II - DISE

Create successful ePaper yourself
Turn your PDF publications into a flip-book with our unique Google optimized e-Paper software.
District<br />
BARAN<br />
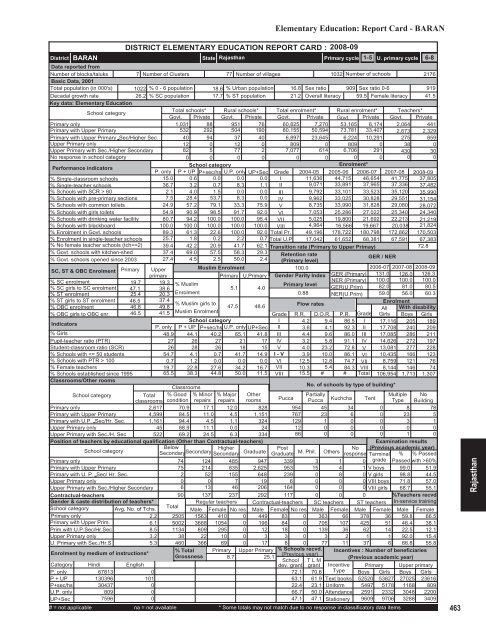
DISTRICT ELEMENTARY EDUCATION REPORT CARD : 2008-09<br />
State Rajasthan<br />
Elementary Education: Report Card - BARAN<br />
Primary cycle<br />
1-5 U. primary cycle 6-8<br />
Data reported from<br />
Number of blocks/taluks<br />
7 Number of Clusters 77 Number of villages<br />
1032 Number of schools<br />
2176<br />
Basic Data, 2001<br />
Total population (in 000's) 1022 % 0 - 6 population 18.6 % Urban population 16.8 Sex ratio 909 Sex ratio 0-6<br />
919<br />
Decadal growth rate<br />
26.2 % SC population 17.7 % ST population 21.2 Overall literacy 59.5 Female literacy 41.5<br />
Key data: Elementary Education<br />
School category<br />
Total schools* Rural schools* Total enrolment* Rural enrolment* Teachers*<br />
Govt. Private Govt. Private Govt. Private Govt. Private Govt. Private<br />
Primary only<br />
1,031 88 951 76 60,825 7,270 53,165 6,174 2,064 441<br />
Primary with Upper Primary<br />
532 292 504 190 80,155 50,594 73,781 33,407 2,673 2,329<br />
Primary with Upper Primary Sec/Higher Sec. 40 94 37 40 6,897 23,645 6,224 10,291 275 859<br />
Upper Primary only<br />
12 0 12 0 809 0 809 0 38 0<br />
Upper Primary with Sec./Higher Secondary<br />
82 5 77 2 7,077 614 6,706 291 430 30<br />
No response in school category<br />
0 0 0 0 0 0 0 0 0 0<br />
Performance indicators<br />
School category<br />
Enrolment*<br />
P. only P + UP P+sec/hs U.P. only UP+Sec Grade 2004-05 2005-06 2006-07 2007-08 2008-09<br />
% Single-classroom schools<br />
15.0 0.6 0.0 0.0 0.0 I 11,636 44,715 46,654 41,775 37,805<br />
% Single-teacher schools<br />
36.7 3.2 0.7 8.3 1.1 <strong>II</strong> 9,071 33,891 37,965 37,336 37,482<br />
% Schools with SCR > 60<br />
2.1 4.0 1.5 0.0 0.0 <strong>II</strong>I 9,792 33,101 33,523 35,120 35,990<br />
% Schools with pre-primary sections 7.5 28.4 53.7 8.3 0.0 IV 9,962 33,025 30,828 29,551 31,154<br />
% Schools with common toilets 24.9 57.2 79.1 33.3 75.9 V 8,735 33,990 31,828 29,080 28,072<br />
% Schools with girls toilets 54.9 90.9 98.5 91.7 92.0 VI 7,053 25,286 27,022 25,340 24,340<br />
% Schools with drinking water facility 80.7 94.2 100.0 100.0 95.4 V<strong>II</strong> 5,025 19,800 21,692 22,213 21,219<br />
% Schools with blackboard<br />
100.0 100.0 100.0 100.0 100.0 V<strong>II</strong>I 4,964 16,566 19,667 20,038 21,824<br />
% Enrolment in Govt. schools 89.3 61.3 22.6 100.0 92.0 Total Pr. 49,196 178,722 180,798 172,862 170,503<br />
% Enrolment in single-teacher schools 25.7 1.8 0.2 2.2 0.7 Total U.P 17,042 61,652 68,381 67,591 67,383<br />
% No female teacher schools (tch>=2) 39.4 42.2 20.9 41.7 62.1 Transition rate (Primary to Upper Primay)<br />
72.8<br />
% Govt. schools with kitchen-shed 37.4 69.0 57.5 58.3 29.3 Retention rate<br />
% Govt. schools opened since 2003 27.4 4.5 2.5 50.0 2.4 (Primary level)<br />
/ NER<br />
GER<br />
SC, ST & OBC Enrolment Primary Upper<br />
Muslim Enrolment<br />
100.0<br />
2006-07 2007-08 2008-09<br />
primary<br />
Primary U.Primary Gender Parity Index GER (Primary) 131.0 126.0 126.3<br />
% SC enrolment<br />
% SC girls to SC enrolment<br />
% ST enrolment<br />
% ST girls to ST enrolment<br />
% OBC enrolment<br />
% OBC girls to OBC enr.<br />
Indicators<br />
% Girls<br />
Pupil-teacher ratio (PTR)<br />
Student-classroom ratio (SCR)<br />
% Schools with 100<br />
% Female teachers<br />
% Schools established since 1995<br />
Classrooms/Other rooms<br />
19.7 19.3 % Muslim<br />
Primary level<br />
47.1 38.6<br />
5.1 4.0<br />
25.4 20.3 Enrolment<br />
0.88<br />
46.5 37.4<br />
% Muslim girls to<br />
47.5 48.6<br />
Flow rates<br />
46.8 49.8<br />
46.5 41.5 Muslim Enrolment<br />
Grade<br />
School category<br />
I<br />
P. only P + UP P+sec/hs U.P. only UP+Sec <strong>II</strong><br />
48.9 44.1 40.2 65.1 41.8 <strong>II</strong>I<br />
27 26 27 21 17 IV<br />
26 28 26 18 15 V 4.0<br />
54.7 4.1 0.7 41.7 14.9 I - V 3.9<br />
0.7 1.2 0.0 0.0 0.0 VI 12.5<br />
19.7 22.8 27.6 34.2 16.7 V<strong>II</strong> 10.3<br />
65.5 38.3 44.8 50.0 11.5 V<strong>II</strong>I 15.5<br />
Classrooms<br />
School category<br />
Total<br />
classrooms<br />
% Good<br />
condition<br />
% Minor<br />
repairs<br />
% Major<br />
repairs<br />
Other<br />
rooms<br />
Primary only<br />
2,617 70.9 17.1 12.0 828<br />
Primary with Upper Primary<br />
4,599 84.5 11.0 4.5 1,151<br />
Primary with U.P. Sec/Hr. Sec. 1,161 94.4 4.5 1.1 324<br />
Upper Primary only<br />
45 88.9 11.1 0.0 24<br />
Upper Primary with Sec./H. Sec<br />
522 69.2 24.5 6.3 334<br />
Position of teachers by educational qualification (Other than Contractual-teachers)<br />
School category<br />
Below<br />
Secondary Higher<br />
Secondary<br />
Secondary Graduate<br />
Primary only<br />
74 124 485 947<br />
Primary with Upper Primary<br />
75 214 835 2,625<br />
Primary with U. P. Sec/ Hr. Sec.<br />
2 52 155 648<br />
Upper Primary only<br />
0 0 7 19<br />
Upper Primary with Sec./Higher Secondary<br />
6 13 46 206<br />
Contractual-teachers<br />
Gender & caste distribution of teachers*<br />
School category Avg. No. of Tchs.<br />
Primary only<br />
2.2<br />
Primary with Upper Prim.<br />
6.1<br />
Prim.with U.P.Sec/Hr.Sec<br />
8.5<br />
Upper Primary only<br />
3.2<br />
U. Primary with Sec./Hr.S<br />
5.3<br />
Enrolment by medium of instructions*<br />
NER (Primary)<br />
GER(U.Prim)<br />
NER(U.Prim)<br />
Grade<br />
9.4 86.5 I<br />
4.1 92.3 <strong>II</strong><br />
9.6 86.0 <strong>II</strong>I<br />
5.8 91.1 IV<br />
23.2 72.8 V<br />
10.0 86.1 VI<br />
12.8 74.7 V<strong>II</strong><br />
5.4 84.3 V<strong>II</strong>I<br />
# # Total<br />
R.R. D.O.R. P.R.<br />
4.2<br />
3.6<br />
4.4<br />
3.2<br />
100.0<br />
82.0<br />
59.0<br />
No. of schools by type of building*<br />
Post<br />
No<br />
Graduate M. Phil. Others response<br />
100.0<br />
81.0<br />
56.0<br />
100.0<br />
80.5<br />
60.3<br />
Enrolment<br />
All With disability<br />
Girls Boys Girls<br />
17,116 205 189<br />
17,708 240 209<br />
17,085 286 211<br />
14,626 272 197<br />
13,081 277 228<br />
10,435 166 123<br />
8,759 121 76<br />
8,144 146 74<br />
106,954 1,713 1,307<br />
Pucca<br />
Partially<br />
Multiple No<br />
Pucca Kuchcha Tent Type Building<br />
954 45 34 0 8 78<br />
767 23 6 0 23 5<br />
129 1 0 0 3 1<br />
12 0 0 0 0 0<br />
86 0 0 0 1 0<br />
339 3 1<br />
953 15 4 1<br />
239 0 8 0<br />
6 0 0 0<br />
164 0 0 0<br />
90 137 237 292 117 0 0 0<br />
Total<br />
Regular teachers Contractual-teachers SC teachers ST teachers<br />
Male Female No res Male Female No res Male Female Male Female<br />
2505 1563 410 0 449 83 0 363 66 378 36<br />
5002 3668 1054 0 196 84 0 706 107 425 51<br />
1134 809 295 0 12 18 0 139 36 62 14<br />
38 22 10 0 3 3 0 3 2 1 1<br />
460 366 69 0 17 8 0 77 11 37 6<br />
% Total Primary Upper Primary % Schools recvd.<br />
Grossness<br />
(Previous year)<br />
8.7<br />
25.1<br />
School T L M<br />
dev. grant grant<br />
Examination results<br />
(Previous academic year)<br />
Terminal % % Passed<br />
0 grade Passed with >60%<br />
V boys 99.0 51.9<br />
V girls 98.8 44.5<br />
V<strong>II</strong>I boys 71.8 57.0<br />
V<strong>II</strong>I girls 68.7 55.1<br />
%Teachers recvd.<br />
In-service training<br />
Male Female<br />
59.8 66.5<br />
46.4 38.1<br />
22.5 12.1<br />
92.0 15.4<br />
66.8 55.8<br />
Incentives : Number of beneficiaries<br />
(Previous academic year)<br />
Category Hindi English<br />
Incentive<br />
P. only<br />
67813<br />
0<br />
72.1 70.6 Type<br />
P + UP<br />
130396<br />
101<br />
63.1 61.9 Text books<br />
P+sec/hs 30437<br />
0<br />
22.4 23.1 Uniform<br />
U.P. only<br />
809<br />
0<br />
66.7 50.0 Attendance<br />
UP+Sec<br />
7596<br />
0<br />
47.1 47.1 Stationery<br />
# = not applicable na = not available * Some totals may not match due to no response in classificatory data items<br />
Primary Upper primary<br />
Boys Girls Boys Girls<br />
52520 53827 27025 23616<br />
5497 5178 1168 809<br />
2591 2332 3048 2200<br />
9609 9706 3288 3409<br />
463<br />
Rajasthan


