

Volume II - DISE
Volume II - DISE
Volume II - DISE

You also want an ePaper? Increase the reach of your titles
YUMPU automatically turns print PDFs into web optimized ePapers that Google loves.
Nagaland<br />
402<br />
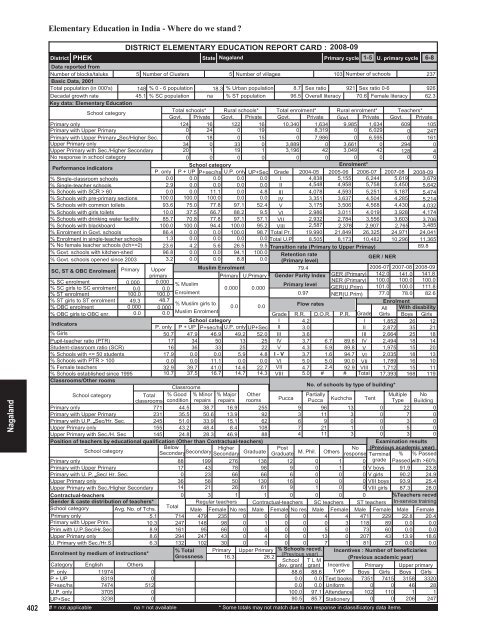
Elementary Education in India - Where do we stand <br />
District<br />
PHEK<br />
DISTRICT ELEMENTARY EDUCATION REPORT CARD : 2008-09<br />
State Nagaland<br />
Primary cycle<br />
1-5 U. primary cycle 6-8<br />
Data reported from<br />
Number of blocks/taluks<br />
5 Number of Clusters 5 Number of villages<br />
103 Number of schools<br />
237<br />
Basic Data, 2001<br />
Total population (in 000's) 148 % 0 - 6 population 18.3 % Urban population 8.7 Sex ratio 921 Sex ratio 0-6<br />
926<br />
Decadal growth rate<br />
45.1 % SC population na % ST population 96.5 Overall literacy 70.6 Female literacy 62.3<br />
Key data: Elementary Education<br />
School category<br />
Total schools* Rural schools* Total enrolment* Rural enrolment* Teachers*<br />
Govt. Private Govt. Private Govt. Private Govt. Private Govt. Private<br />
Primary only<br />
124 16 122 16 10,340 1,634 9,985 1,634 609 105<br />
Primary with Upper Primary<br />
0 24 0 19 0 8,319 0 6,029 0 247<br />
Primary with Upper Primary Sec/Higher Sec.<br />
0 18 0 15 0 7,986 0 6,595 0 161<br />
Upper Primary only<br />
34 0 33 0 3,889 0 3,661 0 294 0<br />
Upper Primary with Sec./Higher Secondary<br />
20 1 19 1 3,196 42 3,049 42 128 4<br />
No response in school category<br />
0 0 0 0 0 0 0 0 0 0<br />
Performance indicators<br />
School category<br />
Enrolment*<br />
P. only P + UP P+sec/hs U.P. only UP+Sec Grade 2004-05 2005-06 2006-07 2007-08 2008-09<br />
% Single-classroom schools<br />
0.0 0.0 0.0 0.0 0.0 I<br />
4,838 5,155 6,244 5,619 3,679<br />
% Single-teacher schools<br />
2.9 0.0 0.0 0.0 0.0 <strong>II</strong> 4,548 4,958 5,758 5,450 5,642<br />
% Schools with SCR > 60<br />
0.0 0.0 11.1 0.0 4.8 <strong>II</strong>I 4,078 4,593 5,251 5,187 5,474<br />
% Schools with pre-primary sections 100.0 100.0 100.0 0.0 0.0 IV 3,351 3,637 4,504 4,285 5,214<br />
% Schools with common toilets 93.6 75.0 77.8 97.1 52.4 V 3,175 3,506 4,568 4,430 4,032<br />
% Schools with girls toilets 10.0 37.5 66.7 88.2 9.5 VI 2,986 3,011 4,019 3,928 4,174<br />
% Schools with drinking water facility 85.7 70.8 77.8 97.1 57.1 V<strong>II</strong> 2,932 2,784 3,556 3,603 3,706<br />
% Schools with blackboard<br />
100.0 100.0 94.4 100.0 95.2 V<strong>II</strong>I 2,587 2,378 2,907 2,765 3,485<br />
% Enrolment in Govt. schools 86.4 0.0 0.0 100.0 98.7 Total Pr. 19,990 21,849 26,325 24,971 24,041<br />
% Enrolment in single-teacher schools 1.3 0.0 0.0 0.0 0.0 Total U.P 8,505 8,173 10,482 10,296 11,365<br />
% No female teacher schools (tch>=2) 23.6 4.2 5.6 26.5 9.5 Transition rate (Primary to Upper Primay)<br />
89.8<br />
% Govt. schools with kitchen-shed 96.8 0.0 0.0 94.1 100.0 Retention rate<br />
% Govt. schools opened since 2003 3.2 0.0 0.0 8.8 0.0 (Primary level)<br />
/ NER<br />
GER<br />
SC, ST & OBC Enrolment Primary Upper<br />
Muslim Enrolment<br />
79.4<br />
2006-07 2007-08 2008-09<br />
primary<br />
Primary U.Primary Gender Parity Index GER (Primary) 142.0 141.0 141.8<br />
% SC enrolment<br />
% SC girls to SC enrolment<br />
% ST enrolment<br />
% ST girls to ST enrolment<br />
% OBC enrolment<br />
% OBC girls to OBC enr.<br />
Indicators<br />
% Girls<br />
Pupil-teacher ratio (PTR)<br />
Student-classroom ratio (SCR)<br />
% Schools with 100<br />
% Female teachers<br />
% Schools established since 1995<br />
Classrooms/Other rooms<br />
0.000 0.000<br />
NER (Primary) 100.0<br />
% Muslim<br />
Primary level<br />
0.0 0.0<br />
0.000 0.000<br />
GER(U.Prim) 101.0<br />
100.0 100.0 Enrolment<br />
0.97 NER(U.Prim) 77.0<br />
49.3 48.7<br />
% Muslim girls to<br />
0.0 0.0<br />
Flow rates<br />
0.000 0.000<br />
0.0 0.0 Muslim Enrolment<br />
Grade R.R. D.O.R. P.R. Grade<br />
School category<br />
I 4.2<br />
I<br />
P. only P + UP P+sec/hs U.P. only UP+Sec <strong>II</strong> 3.0<br />
<strong>II</strong><br />
50.7 47.9 46.9 49.2 52.0 <strong>II</strong>I 3.6<br />
<strong>II</strong>I<br />
17 34 50 13 25 IV 3.7 6.7 89.6 IV<br />
16 36 33 25 22 V 4.3 5.9 89.8 V<br />
17.9 0.0 0.0 5.9 4.8 I - V 3.7 1.6 94.7 VI<br />
0.0 0.0 11.1 0.0 0.0 VI 5.0 5.0 90.0 V<strong>II</strong><br />
32.9 39.7 41.0 14.6 22.7 V<strong>II</strong> 4.7 2.4 92.9 V<strong>II</strong>I<br />
10.7 37.5 16.7 14.7 14.3 V<strong>II</strong>I 5.0 # # Total<br />
Classrooms<br />
School category<br />
Total<br />
classrooms<br />
% Good<br />
condition<br />
% Minor<br />
repairs<br />
% Major<br />
repairs<br />
Other<br />
rooms<br />
Primary only<br />
771 44.5 38.7 16.9 255<br />
Primary with Upper Primary<br />
231 35.5 50.6 13.9 92<br />
Primary with U.P. Sec/Hr. Sec.<br />
245 51.0 33.9 15.1 62<br />
Upper Primary only<br />
155 43.2 48.4 8.4 108<br />
Upper Primary with Sec./H. Sec<br />
145 24.8 28.3 46.9 88<br />
Position of teachers by educational qualification (Other than Contractual-teachers)<br />
School category<br />
Below<br />
Secondary Higher<br />
Secondary<br />
Secondary Graduate<br />
Primary only<br />
88 199 276 138<br />
Primary with Upper Primary<br />
17 43 78 98<br />
Primary with U. P. Sec/ Hr. Sec.<br />
0 23 66 66<br />
Upper Primary only<br />
36 58 50 130<br />
Upper Primary with Sec./Higher Secondary 14 21 26 61<br />
Contractual-teachers<br />
Gender & caste distribution of teachers*<br />
School category Avg. No. of Tchs.<br />
Primary only<br />
5.1<br />
Primary with Upper Prim.<br />
10.3<br />
Prim.with U.P.Sec/Hr.Sec<br />
8.9<br />
Upper Primary only<br />
8.6<br />
U. Primary with Sec./Hr.S<br />
6.3<br />
Enrolment by medium of instructions*<br />
Pucca<br />
No. of schools by type of building*<br />
Post<br />
No<br />
Graduate M. Phil. Others response<br />
100.0<br />
100.0<br />
78.0<br />
100.0<br />
111.8<br />
82.6<br />
Enrolment<br />
All With disability<br />
Girls Boys Girls<br />
1,852 26 12<br />
2,872 35 21<br />
2,664 25 18<br />
2,494 18 14<br />
1,975 15 20<br />
2,035 18 13<br />
1,789 16 10<br />
1,712 15 11<br />
17,393 168 119<br />
Partially<br />
Multiple No<br />
Pucca Kuchcha Tent Type Building<br />
9 96 13 0 22 0<br />
3 11 3 0 7 0<br />
6 9 0 0 3 0<br />
7 21 1 0 5 0<br />
4 11 3 0 3 0<br />
12 0 1<br />
9 0 1 0<br />
6 0 0 0<br />
16 0 0 0<br />
9 1 0 0<br />
0 3 1 1 0 0 0 0<br />
Total<br />
Regular teachers Contractual-teachers SC teachers ST teachers<br />
Male Female No res Male Female No res Male Female Male Female<br />
714 479 235 0 0 0 0 4 4 471 229<br />
247 148 98 0 1 0 0 0 3 118 89<br />
161 95 66 0 0 0 0 5 0 73 60<br />
294 247 43 0 4 0 0 13 0 207 43<br />
132 102 30 0 0 0 0 7 1 81 27<br />
% Total Primary Upper Primary % Schools recvd.<br />
Grossness<br />
(Previous year)<br />
16.3<br />
26.2<br />
School T L M<br />
dev. grant grant<br />
Examination results<br />
(Previous academic year)<br />
Terminal % % Passed<br />
0 grade Passed with >60%<br />
V boys 91.9 23.8<br />
V girls 90.2 24.9<br />
V<strong>II</strong>I boys 93.9 25.4<br />
V<strong>II</strong>I girls 87.3 28.0<br />
%Teachers recvd.<br />
In-service training<br />
Male Female<br />
22.8 20.4<br />
0.0 0.0<br />
0.0 0.0<br />
13.9 18.6<br />
0.0 0.0<br />
Incentives : Number of beneficiaries<br />
(Previous academic year)<br />
Category English Others<br />
Incentive<br />
P. only<br />
11974<br />
0<br />
88.6 88.6 Type<br />
P + UP<br />
8319<br />
0<br />
0.0 0.0 Text books<br />
P+sec/hs<br />
7474<br />
512<br />
0.0 0.0 Uniform<br />
U.P. only<br />
3705<br />
0<br />
100.0 97.1 Attendance<br />
UP+Sec<br />
3238<br />
0<br />
90.5 85.7 Stationery<br />
# = not applicable na = not available * Some totals may not match due to no response in classificatory data items<br />
Primary Upper primary<br />
Boys Girls Boys Girls<br />
7351 7415 3158 3320<br />
0 0 46 28<br />
102 110 1 1<br />
0 0 206 247


