

Volume II - DISE
Volume II - DISE
Volume II - DISE

Create successful ePaper yourself
Turn your PDF publications into a flip-book with our unique Google optimized e-Paper software.
District<br />
NAMAKKAL<br />
State Tamil Nadu<br />
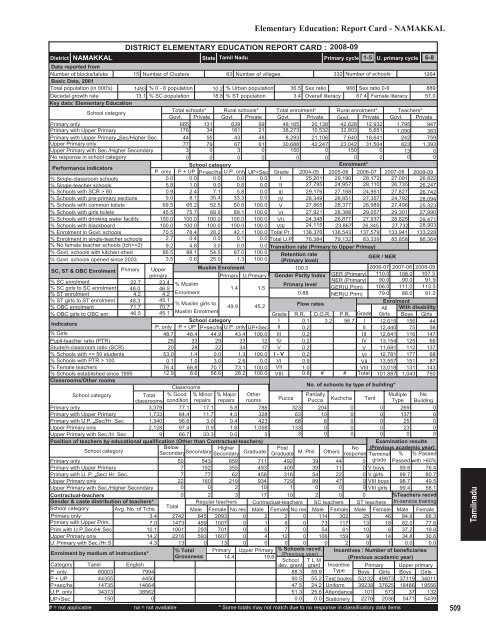
Elementary Education: Report Card - NAMAKKAL<br />
DISTRICT ELEMENTARY EDUCATION REPORT CARD : 2008-09<br />
Primary cycle<br />
1-5 U. primary cycle 6-8<br />
Data reported from<br />
Number of blocks/taluks 15 Number of Clusters 83 Number of villages<br />
332 Number of schools<br />
1264<br />
Basic Data, 2001<br />
Total population (in 000's) 1493 % 0 - 6 population 10.2 % Urban population 36.5 Sex ratio 966 Sex ratio 0-6<br />
889<br />
Decadal growth rate<br />
13.1 % SC population 18.8 % ST population<br />
3.4 Overall literacy 67.4 Female literacy 57.0<br />
Key data: Elementary Education<br />
School category<br />
Total schools* Rural schools* Total enrolment* Rural enrolment* Teachers*<br />
Govt. Private Govt. Private Govt. Private Govt. Private Govt. Private<br />
Primary only<br />
665 131 639 99 48,165 20,138 42,628 12,932 1,795 947<br />
Primary with Upper Primary<br />
176 34 161 21 38,273 10,532 32,803 5,651 1,090 383<br />
Primary with Upper Primary Sec/Higher Sec. 44 55 43 48 8,293 21,106 7,640 18,641 242 759<br />
Upper Primary only<br />
77 79 67 61 30,688 42,247 23,042 31,504 823 1,393<br />
Upper Primary with Sec./Higher Secondary<br />
3 0 3 0 150 0 150 0 13 0<br />
No response in school category<br />
0 0 0 0 0 0 0 0 0 0<br />
Performance indicators<br />
School category<br />
Enrolment*<br />
P. only P + UP P+sec/hs U.P. only UP+Sec Grade 2004-05 2005-06 2006-07 2007-08 2008-09<br />
% Single-classroom schools<br />
0.0 0.0 0.0 0.0 0.0 I 25,201 29,190 28,172 27,091 26,822<br />
% Single-teacher schools<br />
5.8 1.0 0.0 0.6 0.0 <strong>II</strong> 27,785 24,957 28,110 26,735 26,247<br />
% Schools with SCR > 60<br />
0.9 2.4 7.1 5.8 0.0 <strong>II</strong>I 29,176 27,168 24,951 27,827 26,742<br />
% Schools with pre-primary sections 9.0 8.1 35.4 33.3 0.0 IV 28,349 28,851 27,357 24,792 28,094<br />
% Schools with common toilets 69.5 65.2 52.5 50.6 100.0 V 27,865 28,377 28,989 27,496 25,323<br />
% Schools with girls toilets 45.5 75.7 89.9 89.1 100.0 VI 27,921 28,388 29,057 29,301 27,990<br />
% Schools with drinking water facility 100.0 100.0 100.0 100.0 100.0 V<strong>II</strong> 24,348 26,877 27,937 28,825 29,471<br />
% Schools with blackboard<br />
100.0 100.0 100.0 100.0 100.0 V<strong>II</strong>I 24,115 23,867 26,345 27,732 28,903<br />
% Enrolment in Govt. schools 70.5 78.4 28.2 42.1 100.0 Total Pr. 138,376 138,543 137,579 133,941 133,228<br />
% Enrolment in single-teacher schools 2.7 0.4 0.0 0.1 0.0 Total U.P 76,384 79,132 83,339 85,858 86,364<br />
% No female teacher schools (tch>=2) 9.2 4.8 3.0 0.0 0.0 Transition rate (Primary to Upper Primay)<br />
% Govt. schools with kitchen-shed 86.5 88.1 54.5 87.0 100.0 Retention rate<br />
% Govt. schools opened since 2003 3.5 0.6 25.0 1.3 100.0 (Primary level)<br />
/ NER<br />
GER<br />
SC, ST & OBC Enrolment Primary Upper<br />
Muslim Enrolment<br />
100.0<br />
2006-07 2007-08 2008-09<br />
primary<br />
Primary U.Primary Gender Parity Index GER (Primary) 110.0 108.0 107.3<br />
% SC enrolment<br />
% SC girls to SC enrolment<br />
% ST enrolment<br />
% ST girls to ST enrolment<br />
% OBC enrolment<br />
% OBC girls to OBC enr.<br />
Indicators<br />
% Girls<br />
Pupil-teacher ratio (PTR)<br />
Student-classroom ratio (SCR)<br />
% Schools with 100<br />
% Female teachers<br />
% Schools established since 1995<br />
Classrooms/Other rooms<br />
22.7 23.4<br />
NER (Primary) 90.0<br />
% Muslim<br />
Primary level<br />
48.0 46.9<br />
1.4 1.5<br />
GER(U.Prim) 106.0<br />
4.2 4.2 Enrolment<br />
0.88 NER(U.Prim) 79.0<br />
48.3 45.1<br />
% Muslim girls to<br />
49.9 45.2<br />
Flow rates<br />
71.7 70.7<br />
46.5 45.1 Muslim Enrolment<br />
Grade R.R. D.O.R. P.R. Grade<br />
School category<br />
I 0.1 3.2 96.7 I<br />
P. only P + UP P+sec/hs U.P. only UP+Sec <strong>II</strong> 0.2<br />
<strong>II</strong><br />
48.7 48.4 44.9 43.4 100.0 <strong>II</strong>I 0.2<br />
<strong>II</strong>I<br />
25 33 29 33 12 IV 0.2<br />
IV<br />
20 28 22 34 17 V 0.2<br />
V<br />
53.0 1.4 0.0 1.3 100.0 I - V 0.2<br />
VI<br />
0.1 1.0 3.0 2.6 0.0 VI 0.9<br />
V<strong>II</strong><br />
76.4 68.8 70.7 73.1 100.0 V<strong>II</strong> 1.0<br />
V<strong>II</strong>I<br />
12.9 8.6 56.6 28.2 100.0 V<strong>II</strong>I 0.8 # # Total<br />
Classrooms<br />
School category<br />
Total<br />
classrooms<br />
% Good<br />
condition<br />
% Minor<br />
repairs<br />
% Major<br />
repairs<br />
Other<br />
rooms<br />
Primary only<br />
3,379 77.1 17.1 5.8 788<br />
Primary with Upper Primary<br />
1,733 84.4 11.7 4.0 328<br />
Primary with U.P. Sec/Hr. Sec. 1,340 96.6 3.0 0.4 423<br />
Upper Primary only<br />
2,128 97.4 0.9 1.6 1,058<br />
Upper Primary with Sec./H. Sec<br />
9 66.7 33.3 0.0<br />
3<br />
Position of teachers by educational qualification (Other than Contractual-teachers)<br />
School category<br />
Below<br />
Secondary Higher<br />
Secondary<br />
Secondary Graduate<br />
Primary only<br />
50 543 859 711<br />
Primary with Upper Primary<br />
7 152 355 493<br />
Primary with U. P. Sec/ Hr. Sec.<br />
7 77 62 456<br />
Upper Primary only<br />
22 160 219 934<br />
Upper Primary with Sec./Higher Secondary<br />
0 0 2 10<br />
Contractual-teachers<br />
Gender & caste distribution of teachers*<br />
School category Avg. No. of Tchs.<br />
Primary only<br />
3.4<br />
Primary with Upper Prim.<br />
7.0<br />
Prim.with U.P.Sec/Hr.Sec<br />
10.1<br />
Upper Primary only<br />
14.2<br />
U. Primary with Sec./Hr.S<br />
4.3<br />
Enrolment by medium of instructions*<br />
No. of schools by type of building*<br />
Post<br />
No<br />
Graduate M. Phil. Others response<br />
90.0<br />
111.0<br />
88.0<br />
91.9<br />
113.5<br />
91.2<br />
Enrolment<br />
All With disability<br />
Girls Boys Girls<br />
12,615 156 44<br />
12,440 75 58<br />
12,641 116 147<br />
13,154 125 66<br />
11,681 112 137<br />
12,781 177 68<br />
13,557 151 87<br />
13,018 131 143<br />
101,887 1,043 750<br />
Pucca<br />
Partially<br />
Multiple No<br />
Pucca Kuchcha Tent Type Building<br />
323 204 0 0 269 0<br />
63 10 0 0 137 0<br />
68 6 0 0 25 0<br />
133 0 0 0 23 0<br />
3 0 0 0 0 0<br />
492 39 44<br />
409 39 11 0<br />
316 54 22 0<br />
729 89 47 0<br />
1 0 0 0<br />
0 2 3 17 10 2 0 0<br />
Total<br />
Regular teachers Contractual-teachers SC teachers ST teachers<br />
Male Female No res Male Female No res Male Female Male Female<br />
2742 645 2093 0 2 2 0 114 302 25 46<br />
1473 459 1007 0 1 6 0 73 117 13 18<br />
1001 293 701 0 0 7 0 54 61 10 6<br />
2216 593 1607 0 4 12 0 106 159 9 14<br />
13 0 13 0 0 0 0 0 2 0 1<br />
% Total Primary Upper Primary % Schools recvd.<br />
Grossness<br />
(Previous year)<br />
14.4<br />
19.6<br />
School T L M<br />
dev. grant grant<br />
Examination results<br />
(Previous academic year)<br />
Terminal % % Passed<br />
0 grade Passed with >60%<br />
V boys 99.8 76.4<br />
V girls 99.7 80.7<br />
V<strong>II</strong>I boys 98.7 49.5<br />
V<strong>II</strong>I girls 99.4 58.1<br />
%Teachers recvd.<br />
In-service training<br />
Male Female<br />
84.9 66.3<br />
82.0 77.6<br />
37.2 19.8<br />
34.8 30.6<br />
0.0 0.0<br />
Incentives : Number of beneficiaries<br />
(Previous academic year)<br />
Category<br />
P. only<br />
Tamil<br />
60003<br />
English<br />
7994<br />
88.3 59.9<br />
Incentive<br />
Type<br />
P + UP<br />
44355<br />
4450<br />
90.5 55.2 Text books<br />
P+sec/hs 14735 14664<br />
47.5 24.2 Uniform<br />
U.P. only 34373 38562<br />
51.3 25.6 Attendance<br />
UP+Sec<br />
150<br />
0<br />
0.0 0.0 Stationery<br />
# = not applicable na = not available * Some totals may not match due to no response in classificatory data items<br />
Primary Upper primary<br />
Boys Girls Boys Girls<br />
53132 49973 37119 34011<br />
39238 37625 18486 19556<br />
101 573 37 132<br />
2276 2036 5471 5439<br />
509<br />
Tamilnadu


