

Volume II - DISE
Volume II - DISE
Volume II - DISE

Create successful ePaper yourself
Turn your PDF publications into a flip-book with our unique Google optimized e-Paper software.
Punjab<br />
458<br />
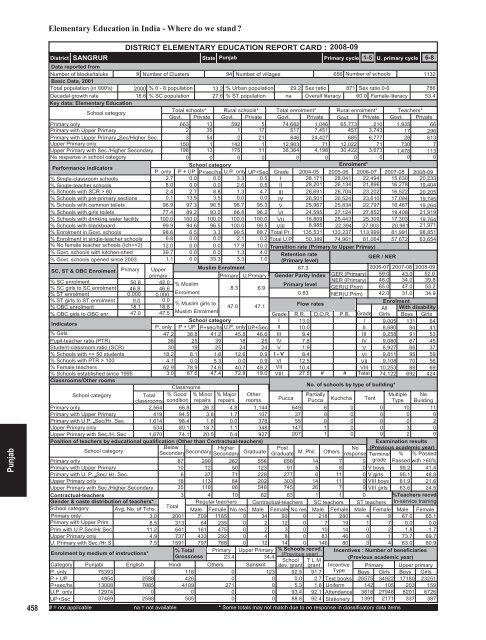
Elementary Education in India - Where do we stand <br />
District<br />
SANGRUR<br />
DISTRICT ELEMENTARY EDUCATION REPORT CARD : 2008-09<br />
State Punjab<br />
Primary cycle<br />
1-5 U. primary cycle 6-8<br />
Data reported from<br />
Number of blocks/taluks<br />
9 Number of Clusters 94 Number of villages<br />
656 Number of schools<br />
1132<br />
Basic Data, 2001<br />
Total population (in 000's) 2000 % 0 - 6 population 13.2 % Urban population 29.2 Sex ratio 871 Sex ratio 0-6<br />
786<br />
Decadal growth rate<br />
18.6 % SC population 27.6 % ST population na Overall literacy 60.0 Female literacy 53.4<br />
Key data: Elementary Education<br />
School category<br />
Total schools* Rural schools* Total enrolment* Rural enrolment* Teachers*<br />
Govt. Private Govt. Private Govt. Private Govt. Private Govt. Private<br />
Primary only<br />
663 13 592 5 74,682 1,046 65,773 210 1,935 66<br />
Primary with Upper Primary<br />
2 35 1 17 517 7,451 457 3,743 17 296<br />
Primary with Upper Primary Sec/Higher Sec.<br />
3 54 2 21 846 24,427 685 6,777 28 613<br />
Upper Primary only<br />
150 1 142 1 12,903 71 12,022 71 730 7<br />
Upper Primary with Sec./Higher Secondary 198 13 175 11 36,364 4,198 30,422 3,673 1,478 113<br />
No response in school category<br />
0 0 0 0 0 0 0 0 0 0<br />
Performance indicators<br />
School category<br />
Enrolment*<br />
P. only P + UP P+sec/hs U.P. only UP+Sec Grade 2004-05 2005-06 2006-07 2007-08 2008-09<br />
% Single-classroom schools<br />
2.7 0.0 0.0 3.3 0.5 I 28,171 28,041 22,494 15,630 20,233<br />
% Single-teacher schools<br />
8.0 0.0 0.0 2.6 0.5 <strong>II</strong> 28,201 26,134 21,896 16,278 19,404<br />
% Schools with SCR > 60<br />
2.4 2.7 8.8 1.3 4.7 <strong>II</strong>I 26,691 26,704 23,202 16,522 20,205<br />
% Schools with pre-primary sections 0.1 13.5 3.5 0.0 0.0 IV 26,501 26,524 23,610 17,094 19,745<br />
% Schools with common toilets 96.9 97.3 96.5 98.7 95.3 V 25,967 25,834 22,797 16,467 19,264<br />
% Schools with girls toilets 77.4 89.2 93.0 86.8 96.2 VI 24,595 27,124 27,852 19,408 21,919<br />
% Schools with drinking water facility 100.0 100.0 100.0 100.0 100.0 V<strong>II</strong> 16,809 25,443 25,309 17,303 19,764<br />
% Schools with blackboard<br />
99.9 94.6 96.5 100.0 99.5 V<strong>II</strong>I 8,985 22,394 27,903 20,961 21,971<br />
% Enrolment in Govt. schools 98.6 6.5 3.3 99.5 89.7 Total Pr. 135,531 133,237 113,999 81,991 98,851<br />
% Enrolment in single-teacher schools 6.8 0.0 0.0 2.1 0.2 Total U.P 50,389 74,961 81,064 57,672 63,654<br />
% No female teacher schools (tch>=2) 12.0 0.0 0.0 17.9 10.0 Transition rate (Primary to Upper Primay)<br />
% Govt. schools with kitchen-shed 39.7 0.0 0.0 1.3 4.0 Retention rate<br />
% Govt. schools opened since 2003 1.1 0.0 33.3 3.3 1.0 (Primary level)<br />
/ NER<br />
GER<br />
SC, ST & OBC Enrolment Primary Upper<br />
Muslim Enrolment<br />
67.3<br />
2006-07 2007-08 2008-09<br />
primary<br />
Primary U.Primary Gender Parity Index GER (Primary) 59.0 43.0 52.0<br />
% SC enrolment<br />
% SC girls to SC enrolment<br />
% ST enrolment<br />
% ST girls to ST enrolment<br />
% OBC enrolment<br />
% OBC girls to OBC enr.<br />
Indicators<br />
% Girls<br />
Pupil-teacher ratio (PTR)<br />
Student-classroom ratio (SCR)<br />
% Schools with 100<br />
% Female teachers<br />
% Schools established since 1995<br />
Classrooms/Other rooms<br />
50.8 42.0<br />
NER (Primary)<br />
% Muslim<br />
Primary level<br />
46.8 46.6<br />
8.3 6.9<br />
GER(U.Prim)<br />
0.000 0.000<br />
Enrolment<br />
0.83 NER(U.Prim)<br />
0.0 0.0<br />
% Muslim girls to<br />
47.0 47.1<br />
Flow rates<br />
18.1 18.8<br />
47.0 47.5 Muslim Enrolment<br />
Grade R.R. D.O.R. P.R. Grade<br />
School category<br />
I 13.0<br />
I<br />
P. only P + UP P+sec/hs U.P. only UP+Sec <strong>II</strong> 10.0<br />
<strong>II</strong><br />
47.2 38.8 41.2 45.8 46.6 <strong>II</strong>I 9.4<br />
<strong>II</strong>I<br />
38 25 39 18 25 IV 7.8<br />
IV<br />
30 19 25 24 24 V 1.9<br />
V<br />
18.2 8.1 1.8 12.6 0.9 I - V 8.4<br />
VI<br />
4.1 0.0 5.3 0.0 0.9 VI 12.5<br />
V<strong>II</strong><br />
62.9 78.9 74.6 40.7 49.2 V<strong>II</strong> 10.4<br />
V<strong>II</strong>I<br />
3.0 67.6 47.4 72.8 19.0 V<strong>II</strong>I 27.5 # # Total<br />
Classrooms<br />
School category<br />
Total<br />
classrooms<br />
% Good<br />
condition<br />
% Minor<br />
repairs<br />
% Major<br />
repairs<br />
Other<br />
rooms<br />
Primary only<br />
2,564 68.8 26.3 4.8 1,144<br />
Primary with Upper Primary<br />
419 94.5 3.8 1.7 107<br />
Primary with U.P. Sec/Hr. Sec. 1,014 98.4 1.6 0.0 378<br />
Upper Primary only<br />
534 80.1 18.7 1.1 348<br />
Upper Primary with Sec./H. Sec 1,670 74.1 20.5 5.4 927<br />
Position of teachers by educational qualification (Other than Contractual-teachers)<br />
School category<br />
Below<br />
Secondary Higher<br />
Secondary<br />
Secondary Graduate<br />
Primary only<br />
87 290 262 556<br />
Primary with Upper Primary<br />
10 12 50 123<br />
Primary with U. P. Sec/ Hr. Sec.<br />
6 37 71 228<br />
Upper Primary only<br />
18 113 64 202<br />
Upper Primary with Sec./Higher Secondary 35 118 86 548<br />
Contractual-teachers<br />
Gender & caste distribution of teachers*<br />
School category Avg. No. of Tchs.<br />
Primary only<br />
3.0<br />
Primary with Upper Prim.<br />
8.5<br />
Prim.with U.P.Sec/Hr.Sec<br />
11.2<br />
Upper Primary only<br />
4.9<br />
U. Primary with Sec./Hr.S<br />
7.5<br />
Enrolment by medium of instructions*<br />
46.0<br />
65.0<br />
42.0<br />
No. of schools by type of building*<br />
Post<br />
No<br />
Graduate M. Phil. Others response<br />
34.0<br />
47.0<br />
31.0<br />
39.8<br />
53.2<br />
34.9<br />
Enrolment<br />
All With disability<br />
Girls Boys Girls<br />
9,005 131 64<br />
8,680 84 41<br />
9,258 91 53<br />
9,080 67 45<br />
8,927 66 37<br />
9,811 95 59<br />
9,108 70 56<br />
10,253 88 69<br />
74,122 692 424<br />
Pucca<br />
Partially<br />
Multiple No<br />
Pucca Kuchcha Tent Type Building<br />
649 6 0 0 10 11<br />
37 0 0 0 0 0<br />
55 0 0 0 0 2<br />
147 1 0 0 3 0<br />
207 1 0 0 2 0<br />
658 14 7<br />
91 5 8 0<br />
277 6 11 0<br />
303 14 11 0<br />
745 26 7 0<br />
3 4 10 82 83 1 1 0<br />
Total<br />
Regular teachers Contractual-teachers SC teachers ST teachers<br />
Male Female No res Male Female No res Male Female Male Female<br />
2001 709 1165 0 34 93 0 218 280 4 9<br />
313 64 235 0 2 12 0 7 19 1 7<br />
641 161 475 0 2 3 0 10 14 0 2<br />
737 433 292 0 4 8 0 83 46 0 1<br />
1591 797 768 0 12 14 0 146 80 3 4<br />
% Total Primary Upper Primary % Schools recvd.<br />
Grossness<br />
(Previous year)<br />
23.4<br />
34.4<br />
School T L M<br />
Hindi Others<br />
dev. grant grant<br />
Examination results<br />
(Previous academic year)<br />
Terminal % % Passed<br />
0 grade Passed with >60%<br />
V boys 99.2 41.4<br />
V girls 95.1 48.8<br />
V<strong>II</strong>I boys 61.9 21.6<br />
V<strong>II</strong>I girls 63.6 24.5<br />
%Teachers recvd.<br />
In-service training<br />
Male Female<br />
67.0 65.1<br />
0.0 0.0<br />
1.8 1.7<br />
73.7 69.7<br />
63.0 60.9<br />
Incentives : Number of beneficiaries<br />
(Previous academic year)<br />
Category Punjabi English<br />
Sanskrit<br />
Incentive<br />
P. only<br />
75393<br />
0<br />
116<br />
0<br />
123 92.5 91.7 Type<br />
P + UP<br />
4954<br />
2588<br />
426<br />
0<br />
0 0.0 2.7 Text books<br />
P+sec/hs 13008<br />
7885<br />
4109<br />
271<br />
0 5.3 1.8 Uniform<br />
U.P. only 12974<br />
0<br />
0<br />
0<br />
0 93.4 92.1 Attendance<br />
UP+Sec<br />
37469<br />
2588<br />
505<br />
0<br />
0 88.6 92.4 Stationery<br />
# = not applicable na = not available * Some totals may not match due to no response in classificatory data items<br />
Primary Upper primary<br />
Boys Girls Boys Girls<br />
26575 34922 17180 23251<br />
142 105 203 159<br />
3818 27948 8201 6726<br />
1391 2171 337 387


