

Volume II - DISE
Volume II - DISE
Volume II - DISE

You also want an ePaper? Increase the reach of your titles
YUMPU automatically turns print PDFs into web optimized ePapers that Google loves.
Tamilnadu<br />
508<br />
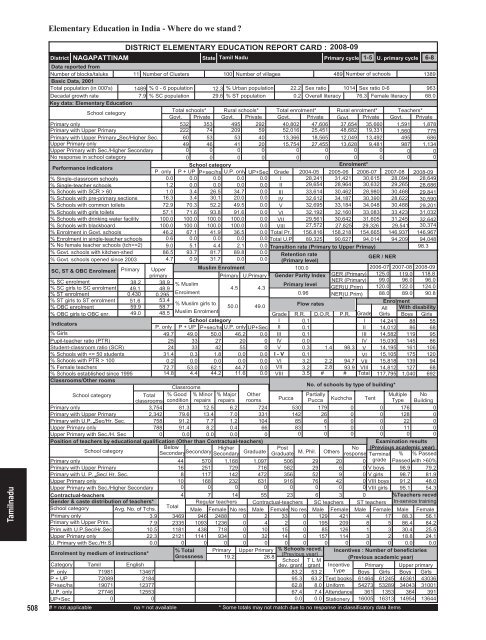
Elementary Education in India - Where do we stand <br />
District<br />
NAGAPATTINAM<br />
DISTRICT ELEMENTARY EDUCATION REPORT CARD : 2008-09<br />
State Tamil Nadu<br />
Primary cycle<br />
1-5 U. primary cycle 6-8<br />
Data reported from<br />
Number of blocks/taluks 11 Number of Clusters 100 Number of villages<br />
489 Number of schools<br />
1389<br />
Basic Data, 2001<br />
Total population (in 000's) 1489 % 0 - 6 population 12.3 % Urban population 22.2 Sex ratio 1014 Sex ratio 0-6<br />
963<br />
Decadal growth rate<br />
7.9 % SC population 29.6 % ST population<br />
0.2 Overall literacy 76.3 Female literacy 68.0<br />
Key data: Elementary Education<br />
School category<br />
Total schools* Rural schools* Total enrolment* Rural enrolment* Teachers*<br />
Govt. Private Govt. Private Govt. Private Govt. Private Govt. Private<br />
Primary only<br />
532 353 495 292 40,802 47,606 37,654 35,660 1,591 1,878<br />
Primary with Upper Primary<br />
222 74 209 59 52,016 25,451 48,682 19,331 1,560 775<br />
Primary with Upper Primary Sec/Higher Sec. 60 53 53 40 13,366 18,565 12,049 13,492 495 686<br />
Upper Primary only<br />
49 46 41 20 15,754 27,455 13,628 9,481 987 1,134<br />
Upper Primary with Sec./Higher Secondary<br />
0 0 0 0 0 0 0 0 0 0<br />
No response in school category<br />
0 0 0 0 0 0 0 0 0 0<br />
Performance indicators<br />
School category<br />
Enrolment*<br />
P. only P + UP P+sec/hs U.P. only UP+Sec Grade 2004-05 2005-06 2006-07 2007-08 2008-09<br />
% Single-classroom schools<br />
0.0 0.0 0.0 0.0 0.0 I 28,241 31,421 30,615 28,094 28,649<br />
% Single-teacher schools<br />
1.2 0.0 0.0 0.0 0.0 <strong>II</strong> 29,654 28,964 30,632 29,265 28,686<br />
% Schools with SCR > 60<br />
1.0 3.4 26.5 34.7 0.0 <strong>II</strong>I 33,614 30,462 28,980 30,468 29,841<br />
% Schools with pre-primary sections 16.3 3.4 30.1 20.0 0.0 IV 32,612 34,187 30,390 28,622 30,590<br />
% Schools with common toilets 72.9 70.3 52.2 49.5 0.0 V 32,695 33,184 34,048 30,488 29,201<br />
% Schools with girls toilets 57.1 71.6 93.8 91.6 0.0 VI 32,192 32,160 33,083 33,423 31,032<br />
% Schools with drinking water facility 100.0 100.0 100.0 100.0 0.0 V<strong>II</strong> 29,561 30,642 31,605 31,245 32,642<br />
% Schools with blackboard<br />
100.0 100.0 100.0 100.0 0.0 V<strong>II</strong>I 27,572 27,825 29,326 29,541 30,374<br />
% Enrolment in Govt. schools 46.2 67.1 41.9 36.5 0.0 Total Pr. 156,816 158,218 154,665 146,937 146,967<br />
% Enrolment in single-teacher schools 0.6 0.0 0.0 0.0 0.0 Total U.P 89,325 90,627 94,014 94,209 94,048<br />
% No female teacher schools (tch>=2) 9.0 5.1 4.4 2.1 0.0 Transition rate (Primary to Upper Primay)<br />
98.3<br />
% Govt. schools with kitchen-shed 86.5 93.7 81.7 89.8 0.0 Retention rate<br />
% Govt. schools opened since 2003 4.7 0.9 31.7 0.0 0.0 (Primary level)<br />
/ NER<br />
GER<br />
SC, ST & OBC Enrolment Primary Upper<br />
Muslim Enrolment<br />
100.0<br />
2006-07 2007-08 2008-09<br />
primary<br />
Primary U.Primary Gender Parity Index GER (Primary) 125.0 119.0 118.8<br />
% SC enrolment<br />
% SC girls to SC enrolment<br />
% ST enrolment<br />
% ST girls to ST enrolment<br />
% OBC enrolment<br />
% OBC girls to OBC enr.<br />
Indicators<br />
% Girls<br />
Pupil-teacher ratio (PTR)<br />
Student-classroom ratio (SCR)<br />
% Schools with 100<br />
% Female teachers<br />
% Schools established since 1995<br />
Classrooms/Other rooms<br />
38.2 38.9<br />
NER (Primary) 99.0<br />
% Muslim<br />
Primary level<br />
49.1 48.9<br />
4.5 4.3<br />
GER(U.Prim) 120.0<br />
0.430 0.295<br />
Enrolment<br />
0.96 NER(U.Prim) 88.0<br />
51.6 53.4<br />
% Muslim girls to<br />
50.0 49.0<br />
Flow rates<br />
59.9 58.7<br />
49.0 48.5 Muslim Enrolment<br />
Grade R.R. D.O.R. P.R. Grade<br />
School category<br />
I 0.1<br />
I<br />
P. only P + UP P+sec/hs U.P. only UP+Sec <strong>II</strong> 0.1<br />
<strong>II</strong><br />
49.7 49.0 50.0 46.2 0.0 <strong>II</strong>I 0.1<br />
<strong>II</strong>I<br />
25 33 27 20 0 IV 0.0<br />
IV<br />
24 33 42 55 0 V 0.3 1.4 98.3 V<br />
31.4 0.3 1.8 0.0 0.0 I - V 0.1<br />
VI<br />
0.2 0.0 0.0 0.0 0.0 VI 3.2 2.2 94.7 V<strong>II</strong><br />
72.7 53.0 62.1 44.7 0.0 V<strong>II</strong> 3.2 2.8 93.9 V<strong>II</strong>I<br />
14.8 4.4 44.2 11.6 0.0 V<strong>II</strong>I 3.5 # # Total<br />
Classrooms<br />
School category<br />
Total<br />
classrooms<br />
% Good<br />
condition<br />
% Minor<br />
repairs<br />
% Major<br />
repairs<br />
Other<br />
rooms<br />
Primary only<br />
3,754 81.3 12.5 6.2 724<br />
Primary with Upper Primary<br />
2,342 79.6 13.4 7.0 331<br />
Primary with U.P. Sec/Hr. Sec.<br />
758 91.2 7.7 1.2 104<br />
Upper Primary only<br />
788 91.4 8.2 0.4 66<br />
Upper Primary with Sec./H. Sec<br />
0 0.0 0.0 0.0<br />
0<br />
Position of teachers by educational qualification (Other than Contractual-teachers)<br />
School category<br />
Below<br />
Secondary Higher<br />
Secondary<br />
Secondary Graduate<br />
Primary only<br />
44 570 1,168 1,097<br />
Primary with Upper Primary<br />
16 251 729 716<br />
Primary with U. P. Sec/ Hr. Sec.<br />
8 117 142 472<br />
Upper Primary only<br />
10 168 232 631<br />
Upper Primary with Sec./Higher Secondary<br />
0 0 0 0<br />
Contractual-teachers<br />
Gender & caste distribution of teachers*<br />
School category Avg. No. of Tchs.<br />
Primary only<br />
3.9<br />
Primary with Upper Prim.<br />
7.9<br />
Prim.with U.P.Sec/Hr.Sec<br />
10.5<br />
Upper Primary only<br />
22.3<br />
U. Primary with Sec./Hr.S<br />
0.0<br />
Enrolment by medium of instructions*<br />
No. of schools by type of building*<br />
Post<br />
No<br />
Graduate M. Phil. Others response<br />
96.0<br />
122.0<br />
89.0<br />
96.0<br />
124.0<br />
90.8<br />
Enrolment<br />
All With disability<br />
Girls Boys Girls<br />
14,241 88 55<br />
14,012 86 68<br />
14,582 119 95<br />
15,030 145 86<br />
14,195 161 106<br />
15,105 175 120<br />
15,818 139 94<br />
14,812 127 68<br />
117,795 1,040 692<br />
Pucca<br />
Partially<br />
Multiple No<br />
Pucca Kuchcha Tent Type Building<br />
530 179 0 0 176 0<br />
142 26 0 0 128 0<br />
85 6 0 0 22 0<br />
83 1 0 0 11 0<br />
0 0 0 0 0 0<br />
506 29 20<br />
582 29 6 0<br />
356 52 9 0<br />
916 76 42 0<br />
0 0 0 0<br />
4 7 14 55 23 6 3 0<br />
Total<br />
Regular teachers Contractual-teachers SC teachers ST teachers<br />
Male Female No res Male Female No res Male Female Male Female<br />
3469 946 2488 0 2 33 0 129 421 4 17<br />
2335 1093 1236 0 4 2 0 195 209 8 5<br />
1181 438 718 0 10 15 0 85 126 1 3<br />
2121 1141 934 0 32 14 0 157 114 3 2<br />
0 0 0 0 0 0 0 0 0 0 0<br />
% Total Primary Upper Primary % Schools recvd.<br />
Grossness<br />
(Previous year)<br />
19.2<br />
26.8<br />
School T L M<br />
dev. grant grant<br />
Examination results<br />
(Previous academic year)<br />
Terminal % % Passed<br />
0 grade Passed with >60%<br />
V boys 98.9 79.2<br />
V girls 98.7 81.9<br />
V<strong>II</strong>I boys 91.2 48.0<br />
V<strong>II</strong>I girls 95.1 54.3<br />
%Teachers recvd.<br />
In-service training<br />
Male Female<br />
88.3 56.1<br />
86.4 84.2<br />
30.4 25.5<br />
18.8 24.1<br />
0.0 0.0<br />
Incentives : Number of beneficiaries<br />
(Previous academic year)<br />
Category<br />
P. only<br />
Tamil<br />
71981<br />
English<br />
13467<br />
83.2 53.2<br />
Incentive<br />
Type<br />
P + UP<br />
72089<br />
2184<br />
95.3 63.2 Text books<br />
P+sec/hs 19071 12377<br />
62.8 8.0 Uniform<br />
U.P. only 27746 12553<br />
67.4 7.4 Attendance<br />
UP+Sec<br />
0<br />
0<br />
0.0 0.0 Stationery<br />
# = not applicable na = not available * Some totals may not match due to no response in classificatory data items<br />
Primary Upper primary<br />
Boys Girls Boys Girls<br />
61464 61245 46361 43036<br />
54273 53289 34043 31001<br />
361 1353 364 391<br />
16005 16313 14954 13644


