

Volume II - DISE
Volume II - DISE
Volume II - DISE

Create successful ePaper yourself
Turn your PDF publications into a flip-book with our unique Google optimized e-Paper software.
Tamilnadu<br />
518<br />
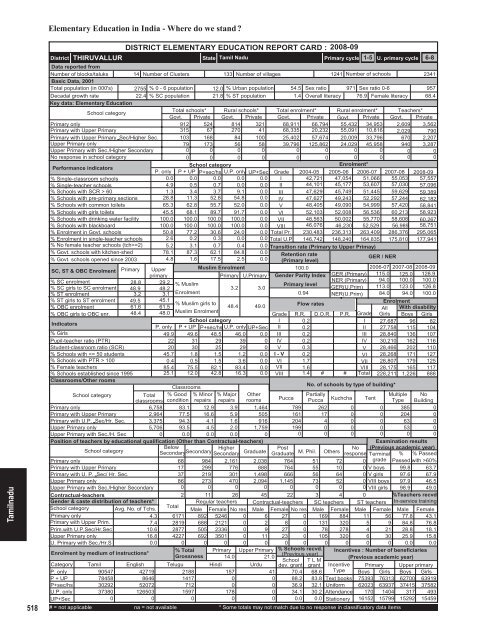
Elementary Education in India - Where do we stand <br />
District<br />
THIRUVALLUR<br />
DISTRICT ELEMENTARY EDUCATION REPORT CARD : 2008-09<br />
State Tamil Nadu<br />
Primary cycle<br />
1-5 U. primary cycle 6-8<br />
Data reported from<br />
Number of blocks/taluks 14 Number of Clusters 133 Number of villages<br />
1241 Number of schools<br />
2341<br />
Basic Data, 2001<br />
Total population (in 000's) 2755 % 0 - 6 population 12.0 % Urban population 54.5 Sex ratio 971 Sex ratio 0-6<br />
957<br />
Decadal growth rate<br />
22.4 % SC population 21.8 % ST population<br />
1.4 Overall literacy 76.9 Female literacy 68.4<br />
Key data: Elementary Education<br />
School category<br />
Total schools* Rural schools* Total enrolment* Rural enrolment* Teachers*<br />
Govt. Private Govt. Private Govt. Private Govt. Private Govt. Private<br />
Primary only<br />
912 524 814 321 68,911 66,794 55,432 34,953 2,609 3,562<br />
Primary with Upper Primary<br />
315 67 270 41 68,335 20,232 55,091 10,816 2,029 790<br />
Primary with Upper Primary Sec/Higher Sec. 103 168 84 100 25,402 57,674 20,009 33,796 670 2,207<br />
Upper Primary only<br />
79 173 56 58 39,796 125,862 24,029 45,958 940 3,287<br />
Upper Primary with Sec./Higher Secondary<br />
0 0 0 0 0 0 0 0 0 0<br />
No response in school category<br />
0 0 0 0 0 0 0 0 0 0<br />
Performance indicators<br />
School category<br />
Enrolment*<br />
P. only P + UP P+sec/hs U.P. only UP+Sec Grade 2004-05 2005-06 2006-07 2007-08 2008-09<br />
% Single-classroom schools<br />
0.0 0.0 0.0 0.0 0.0 I 42,721 47,054 51,066 55,053 57,557<br />
% Single-teacher schools<br />
4.9 0.5 0.7 0.0 0.0 <strong>II</strong> 44,101 45,177 53,607 57,030 57,096<br />
% Schools with SCR > 60<br />
1.3 3.4 3.7 9.1 0.0 <strong>II</strong>I 47,629 45,749 51,445 59,629 59,389<br />
% Schools with pre-primary sections 28.8 11.3 52.8 54.8 0.0 IV 47,627 49,243 52,292 57,244 62,182<br />
% Schools with common toilets 65.3 62.8 55.7 52.0 0.0 V 48,405 49,090 54,999 57,420 58,841<br />
% Schools with girls toilets 45.5 68.1 89.7 91.7 0.0 VI 52,103 52,008 56,536 60,213 58,923<br />
% Schools with drinking water facility 100.0 100.0 100.0 100.0 0.0 V<strong>II</strong> 48,563 50,002 55,770 58,608 60,267<br />
% Schools with blackboard<br />
100.0 100.0 100.0 100.0 0.0 V<strong>II</strong>I 46,076 46,230 52,529 56,989 58,751<br />
% Enrolment in Govt. schools 50.8 77.2 30.6 24.0 0.0 Total Pr. 230,483 236,313 263,409 286,376 295,065<br />
% Enrolment in single-teacher schools 2.6 0.2 0.3 0.0 0.0 Total U.P 146,742 148,240 164,835 175,810 177,941<br />
% No female teacher schools (tch>=2) 5.2 3.1 0.7 0.4 0.0 Transition rate (Primary to Upper Primay)<br />
% Govt. schools with kitchen-shed 78.1 87.3 62.1 84.8 0.0 Retention rate<br />
% Govt. schools opened since 2003 4.8 1.6 17.5 2.5 0.0 (Primary level)<br />
/ NER<br />
GER<br />
SC, ST & OBC Enrolment Primary Upper<br />
Muslim Enrolment<br />
100.0<br />
2006-07 2007-08 2008-09<br />
primary<br />
Primary U.Primary Gender Parity Index GER (Primary) 115.0 125.0 128.9<br />
% SC enrolment<br />
% SC girls to SC enrolment<br />
% ST enrolment<br />
% ST girls to ST enrolment<br />
% OBC enrolment<br />
% OBC girls to OBC enr.<br />
Indicators<br />
% Girls<br />
Pupil-teacher ratio (PTR)<br />
Student-classroom ratio (SCR)<br />
% Schools with 100<br />
% Female teachers<br />
% Schools established since 1995<br />
Classrooms/Other rooms<br />
28.8 29.2<br />
NER (Primary)<br />
% Muslim<br />
Primary level<br />
48.9 48.2<br />
3.2 3.0<br />
GER(U.Prim)<br />
3.2 3.1 Enrolment<br />
0.94 NER(U.Prim)<br />
49.5 45.1<br />
% Muslim girls to<br />
48.4 49.0<br />
Flow rates<br />
61.6 61.5<br />
48.4 48.0 Muslim Enrolment<br />
Grade R.R. D.O.R. P.R.<br />
School category<br />
I 0.2<br />
P. only P + UP P+sec/hs U.P. only UP+Sec <strong>II</strong> 0.2<br />
49.9 49.6 48.5 46.0 0.0 <strong>II</strong>I 0.2<br />
22 31 29 39 0 IV 0.2<br />
20 30 25 29 0 V 0.3<br />
45.7 1.8 1.5 1.2 0.0 I - V 0.2<br />
0.4 0.5 1.5 3.6 0.0 VI 1.7<br />
85.4 75.5 82.1 83.4 0.0 V<strong>II</strong> 1.6<br />
25.1 12.0 42.8 16.3 0.0 V<strong>II</strong>I 1.4 # #<br />
Classrooms<br />
School category<br />
Total<br />
classrooms<br />
% Good<br />
condition<br />
% Minor<br />
repairs<br />
% Major<br />
repairs<br />
Other<br />
rooms<br />
Primary only<br />
6,758 83.1 12.9 3.9 1,464<br />
Primary with Upper Primary<br />
2,964 77.5 16.6 5.9 505<br />
Primary with U.P. Sec/Hr. Sec. 3,375 94.3 4.1 1.6 916<br />
Upper Primary only<br />
5,706 93.5 4.5 2.0 1,759<br />
Upper Primary with Sec./H. Sec<br />
0 0.0 0.0 0.0<br />
0<br />
Position of teachers by educational qualification (Other than Contractual-teachers)<br />
School category<br />
Below<br />
Secondary Higher<br />
Secondary<br />
Secondary Graduate<br />
Primary only<br />
68 984 2,161 2,038<br />
Primary with Upper Primary<br />
17 299 776 888<br />
Primary with U. P. Sec/ Hr. Sec.<br />
37 219 301 1,498<br />
Upper Primary only<br />
86 273 470 2,094<br />
Upper Primary with Sec./Higher Secondary<br />
0 0 0 0<br />
Contractual-teachers<br />
Gender & caste distribution of teachers*<br />
School category Avg. No. of Tchs.<br />
Primary only<br />
4.3<br />
Primary with Upper Prim.<br />
7.4<br />
Prim.with U.P.Sec/Hr.Sec<br />
10.6<br />
Upper Primary only<br />
16.8<br />
U. Primary with Sec./Hr.S<br />
0.0<br />
Enrolment by medium of instructions*<br />
Grade<br />
I<br />
<strong>II</strong><br />
<strong>II</strong>I<br />
IV<br />
V<br />
VI<br />
V<strong>II</strong><br />
V<strong>II</strong>I<br />
Total<br />
94.0<br />
113.0<br />
84.0<br />
No. of schools by type of building*<br />
Post<br />
No<br />
Graduate M. Phil. Others response<br />
100.0<br />
123.0<br />
94.0<br />
100.0<br />
126.8<br />
100.0<br />
Enrolment<br />
All With disability<br />
Girls Boys Girls<br />
27,687 96 82<br />
27,758 115 104<br />
28,840 136 107<br />
30,210 162 116<br />
28,466 202 110<br />
28,268 171 127<br />
28,807 179 125<br />
28,175 165 117<br />
228,211 1,226 888<br />
Pucca<br />
Partially<br />
Multiple No<br />
Pucca Kuchcha Tent Type Building<br />
789 262 0 0 385 0<br />
161 17 0 0 204 0<br />
204 4 0 0 63 0<br />
199 0 0 0 53 0<br />
0 0 0 0 0 0<br />
764 51 72<br />
764 55 10 0<br />
666 56 64 0<br />
1,145 73 52 0<br />
0 0 0 0<br />
2 11 26 45 22 3 4 0<br />
Total<br />
Regular teachers Contractual-teachers SC teachers ST teachers<br />
Male Female No res Male Female No res Male Female Male Female<br />
6171 892 5246 0 6 27 0 169 884 11 56<br />
2819 688 2121 0 2 8 0 131 320 5 9<br />
2877 505 2336 0 9 27 0 78 278 4 21<br />
4227 692 3501 0 11 23 0 105 320 6 30<br />
0 0 0 0 0 0 0 0 0 0 0<br />
% Total Primary Upper Primary % Schools recvd.<br />
Grossness<br />
(Previous year)<br />
14.0<br />
21.0<br />
School T L M<br />
Telugu Hindi<br />
Urdu dev. grant grant<br />
Examination results<br />
(Previous academic year)<br />
Terminal % % Passed<br />
0 grade Passed with >60%<br />
V boys 99.8 63.7<br />
V girls 97.6 67.9<br />
V<strong>II</strong>I boys 97.9 46.5<br />
V<strong>II</strong>I girls 98.9 49.0<br />
%Teachers recvd.<br />
In-service training<br />
Male Female<br />
77.8 43.1<br />
84.8 76.8<br />
28.8 18.1<br />
25.9 15.8<br />
0.0 0.0<br />
Incentives : Number of beneficiaries<br />
(Previous academic year)<br />
Category<br />
P. only<br />
Tamil<br />
90547<br />
English<br />
42719<br />
2188<br />
157<br />
41 70.4 68.6<br />
Incentive<br />
Type<br />
P + UP<br />
78458<br />
8646<br />
1417<br />
0<br />
0 88.2 83.8 Text books<br />
P+sec/hs 30292 52072<br />
712<br />
0<br />
0 36.9 32.1 Uniform<br />
U.P. only 37380 126503<br />
1597<br />
178<br />
0 34.1 30.2 Attendance<br />
UP+Sec<br />
0<br />
0<br />
0<br />
0<br />
0 0.0 0.0 Stationery<br />
# = not applicable na = not available * Some totals may not match due to no response in classificatory data items<br />
Primary Upper primary<br />
Boys Girls Boys Girls<br />
75393 76313 62700 63919<br />
62023 63937 37415 37582<br />
170 1404 317 493<br />
16152 15799 15292 15459


