

Volume II - DISE
Volume II - DISE
Volume II - DISE

You also want an ePaper? Increase the reach of your titles
YUMPU automatically turns print PDFs into web optimized ePapers that Google loves.
District<br />
NAYAGARH<br />
State Orissa<br />
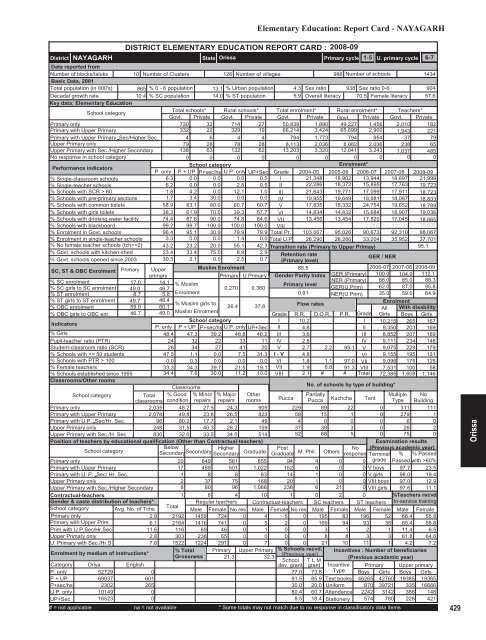
Elementary Education: Report Card - NAYAGARH<br />
DISTRICT ELEMENTARY EDUCATION REPORT CARD : 2008-09<br />
Primary cycle<br />
1-5 U. primary cycle 6-7<br />
Data reported from<br />
Number of blocks/taluks 10 Number of Clusters 126 Number of villages<br />
986 Number of schools<br />
1434<br />
Basic Data, 2001<br />
Total population (in 000's) 865 % 0 - 6 population 13.1 % Urban population 4.3 Sex ratio 938 Sex ratio 0-6<br />
904<br />
Decadal growth rate<br />
10.4 % SC population 14.0 % ST population<br />
5.9 Overall literacy 70.5 Female literacy 57.6<br />
Key data: Elementary Education<br />
School category<br />
Total schools* Rural schools* Total enrolment* Rural enrolment* Teachers*<br />
Govt. Private Govt. Private Govt. Private Govt. Private Govt. Private<br />
Primary only<br />
730 32 714 27 50,839 1,890 49,227 1,456 2,010 182<br />
Primary with Upper Primary<br />
332 22 329 19 66,214 3,424 65,699 2,900 1,943 221<br />
Primary with Upper Primary Sec/Higher Sec.<br />
4 6 4 4 794 1,773 794 954 37 79<br />
Upper Primary only<br />
79 28 78 28 8,113 2,036 8,082 2,036 238 65<br />
Upper Primary with Sec./Higher Secondary 138 63 132 62 13,203 3,320 12,041 3,243 1,037 485<br />
No response in school category<br />
0 0 0 0 0 0 0 0 0 0<br />
Performance indicators<br />
School category<br />
Enrolment*<br />
P. only P + UP P+sec/hs U.P. only UP+Sec Grade 2004-05 2005-06 2006-07 2007-08 2008-09<br />
% Single-classroom schools<br />
6.3 0.0 0.0 0.0 0.5 I 21,348 18,902 13,944 18,897 21,999<br />
% Single-teacher schools<br />
6.2 0.0 0.0 2.8 0.5 <strong>II</strong> 22,286 18,372 15,895 17,763 19,723<br />
% Schools with SCR > 60<br />
1.8 4.2 0.0 12.1 1.0 <strong>II</strong>I 21,643 19,771 17,099 17,911 18,723<br />
% Schools with pre-primary sections 1.7 3.4 30.0 0.0 0.0 IV 19,955 19,649 18,981 18,087 18,833<br />
% Schools with common toilets 58.9 83.1 80.0 60.7 60.7 V 17,835 18,332 24,754 19,652 18,789<br />
% Schools with girls toilets 38.3 61.9 70.0 39.3 57.7 VI 14,834 14,832 15,684 18,907 19,036<br />
% Schools with drinking water facility 74.4 87.6 90.0 74.8 84.6 V<strong>II</strong> 13,456 13,454 17,520 17,045 18,665<br />
% Schools with blackboard<br />
99.2 99.7 100.0 100.0 100.0 V<strong>II</strong>I<br />
2,210 13,231 15,838<br />
% Enrolment in Govt. schools 96.4 95.1 30.9 79.9 79.9 Total Pr. 103,067 95,026 90,673 92,310 98,067<br />
% Enrolment in single-teacher schools 3.3 0.0 0.0 1.4 0.0 Total U.P 28,290 28,286 33,204 35,952 37,701<br />
% No female teacher schools (tch>=2) 43.2 23.2 20.0 55.1 42.3 Transition rate (Primary to Upper Primay)<br />
95.1<br />
% Govt. schools with kitchen-shed 23.4 33.4 75.0 8.9 2.9 Retention rate<br />
% Govt. schools opened since 2003 30.3 2.1 0.0 2.5 0.7 (Primary level)<br />
/ NER<br />
GER<br />
SC, ST & OBC Enrolment Primary Upper<br />
Muslim Enrolment<br />
85.5<br />
2006-07 2007-08 2008-09<br />
primary<br />
Primary U.Primary Gender Parity Index GER (Primary) 100.0 104.0 112.1<br />
% SC enrolment<br />
% SC girls to SC enrolment<br />
% ST enrolment<br />
% ST girls to ST enrolment<br />
% OBC enrolment<br />
% OBC girls to OBC enr.<br />
Indicators<br />
% Girls<br />
Pupil-teacher ratio (PTR)<br />
Student-classroom ratio (SCR)<br />
% Schools with 100<br />
% Female teachers<br />
% Schools established since 1995<br />
Classrooms/Other rooms<br />
17.0 14.1<br />
NER (Primary)<br />
% Muslim<br />
Primary level<br />
49.0 46.7<br />
0.270 0.360<br />
GER(U.Prim)<br />
8.7 5.8 Enrolment<br />
0.91 NER(U.Prim)<br />
49.7 46.4<br />
% Muslim girls to<br />
26.4 37.8<br />
Flow rates<br />
59.0 60.1<br />
46.7 49.0 Muslim Enrolment<br />
Grade R.R. D.O.R. P.R. Grade<br />
School category<br />
I 10.2<br />
I<br />
P. only P + UP P+sec/hs U.P. only UP+Sec <strong>II</strong> 4.8<br />
<strong>II</strong><br />
48.4 47.3 39.2 48.8 48.2 <strong>II</strong>I 3.6<br />
<strong>II</strong>I<br />
24 32 22 33 11 IV 2.6<br />
IV<br />
26 34 27 41 20 V 2.7 2.2 95.1 V<br />
47.5 1.1 0.0 7.5 31.3 I - V 4.8<br />
VI<br />
0.0 0.3 0.0 0.0 0.0 VI 1.8 1.1 97.0 V<strong>II</strong><br />
33.3 34.3 39.7 21.5 19.1 V<strong>II</strong> 1.9 6.8 91.3 V<strong>II</strong>I<br />
34.4 7.6 30.0 11.2 10.0 V<strong>II</strong>I 2.1 # # Total<br />
Classrooms<br />
School category<br />
Total<br />
classrooms<br />
% Good<br />
condition<br />
% Minor<br />
repairs<br />
% Major<br />
repairs<br />
Other<br />
rooms<br />
Primary only<br />
2,035 48.2 27.5 24.3 909<br />
Primary with Upper Primary<br />
2,078 49.8 23.8 26.5 823<br />
Primary with U.P. Sec/Hr. Sec.<br />
96 80.2 17.7 2.1 49<br />
Upper Primary only<br />
248 31.5 40.3 28.2 159<br />
Upper Primary with Sec./H. Sec<br />
830 32.0 33.5 34.5 514<br />
Position of teachers by educational qualification (Other than Contractual-teachers)<br />
School category<br />
Below<br />
Secondary Higher<br />
Secondary<br />
Secondary Graduate<br />
Primary only<br />
20 649 561 855<br />
Primary with Upper Primary<br />
17 459 501 1,022<br />
Primary with U. P. Sec/ Hr. Sec.<br />
1 8 8 83<br />
Upper Primary only<br />
2 37 75 168<br />
Upper Primary with Sec./Higher Secondary<br />
8 80 96 1,066<br />
Contractual-teachers<br />
Gender & caste distribution of teachers*<br />
School category Avg. No. of Tchs.<br />
Primary only<br />
2.9<br />
Primary with Upper Prim.<br />
6.1<br />
Prim.with U.P.Sec/Hr.Sec<br />
11.6<br />
Upper Primary only<br />
2.8<br />
U. Primary with Sec./Hr.S<br />
7.6<br />
Enrolment by medium of instructions*<br />
66.0<br />
62.0<br />
35.0<br />
No. of schools by type of building*<br />
Post<br />
No<br />
Graduate M. Phil. Others response<br />
85.0<br />
87.0<br />
59.0<br />
88.3<br />
95.8<br />
64.9<br />
Enrolment<br />
All With disability<br />
Girls Boys Girls<br />
10,215 265 167<br />
9,350 203 169<br />
8,852 207 169<br />
9,111 234 148<br />
9,075 229 179<br />
9,155 195 131<br />
9,096 175 125<br />
7,531 100 58<br />
72,385 1,608 1,146<br />
Pucca<br />
Partially<br />
Multiple No<br />
Pucca Kuchcha Tent Type Building<br />
229 89 22 0 311 111<br />
58 15 1 0 279 1<br />
4 0 0 0 6 0<br />
37 39 3 0 26 2<br />
52 68 5 0 75 0<br />
94 4 0<br />
152 6 0 0<br />
14 1 0 0<br />
20 1 0 0<br />
238 6 21 0<br />
1 6 4 10 1 0 2 0<br />
Total<br />
Regular teachers Contractual-teachers SC teachers ST teachers<br />
Male Female No res Male Female No res Male Female Male Female<br />
2192 1459 724 0 4 5 0 195 63 196 52<br />
2164 1416 741 0 5 2 0 169 94 93 38<br />
116 69 46 0 1 0 0 3 1 2 1<br />
303 238 65 0 0 0 0 8 8 3 3<br />
1522 1224 291 0 7 0 0 21 10 11 1<br />
% Total Primary Upper Primary % Schools recvd.<br />
Grossness<br />
(Previous year)<br />
21.3<br />
32.3<br />
School T L M<br />
dev. grant grant<br />
Examination results<br />
(Previous academic year)<br />
Terminal % % Passed<br />
0 grade Passed with >60%<br />
V boys 97.7 23.5<br />
V girls 98.0 19.4<br />
V<strong>II</strong>I boys 97.0 12.9<br />
V<strong>II</strong>I girls 97.6 11.1<br />
%Teachers recvd.<br />
In-service training<br />
Male Female<br />
66.4 55.8<br />
65.4 58.8<br />
11.4 6.5<br />
61.8 64.6<br />
4.2 7.2<br />
Incentives : Number of beneficiaries<br />
(Previous academic year)<br />
Category Oriya English<br />
Incentive<br />
P. only<br />
52729<br />
0<br />
77.0 73.8 Type<br />
P + UP<br />
69037<br />
601<br />
91.5 85.9 Text books<br />
P+sec/hs<br />
2302<br />
265<br />
30.0 20.0 Uniform<br />
U.P. only 10149<br />
0<br />
80.4 60.7 Attendance<br />
UP+Sec<br />
16523<br />
0<br />
8.5 18.4 Stationery<br />
# = not applicable na = not available * Some totals may not match due to no response in classificatory data items<br />
Primary Upper primary<br />
Boys Girls Boys Girls<br />
46265 42760 19385 19365<br />
870 39721 335 16666<br />
2242 3142 386 148<br />
574 780 228 421<br />
429<br />
Orissa


