

Volume II - DISE
Volume II - DISE
Volume II - DISE

Create successful ePaper yourself
Turn your PDF publications into a flip-book with our unique Google optimized e-Paper software.
Rajasthan<br />
476<br />
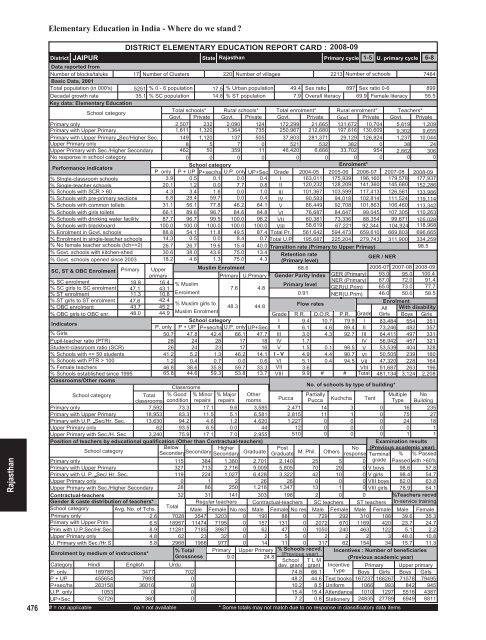
Elementary Education in India - Where do we stand <br />
District<br />
JAIPUR<br />
DISTRICT ELEMENTARY EDUCATION REPORT CARD : 2008-09<br />
State Rajasthan<br />
Primary cycle<br />
1-5 U. primary cycle 6-8<br />
Data reported from<br />
Number of blocks/taluks 17 Number of Clusters 220 Number of villages<br />
2213 Number of schools<br />
7464<br />
Basic Data, 2001<br />
Total population (in 000's) 5251 % 0 - 6 population 17.5 % Urban population 49.4 Sex ratio 897 Sex ratio 0-6<br />
899<br />
Decadal growth rate<br />
35.1 % SC population 14.8 % ST population<br />
7.9 Overall literacy 69.9 Female literacy 55.5<br />
Key data: Elementary Education<br />
School category<br />
Total schools* Rural schools* Total enrolment* Rural enrolment* Teachers*<br />
Govt. Private Govt. Private Govt. Private Govt. Private Govt. Private<br />
Primary only<br />
2,507 232 2,090 124 172,299 21,665 131,672 10,704 5,819 1,209<br />
Primary with Upper Primary<br />
1,611 1,320 1,364 735 250,967 212,680 197,616 130,609 9,302 9,655<br />
Primary with Upper Primary Sec/Higher Sec. 149 1,120 137 505 37,803 281,371 29,129 126,824 1,237 10,044<br />
Upper Primary only<br />
8 5 7 0 521 532 382 0 38 24<br />
Upper Primary with Sec./Higher Secondary 462 50 359 11 46,420 6,666 33,702 954 2,662 306<br />
No response in school category<br />
0 0 0 0 0 0 0 0 0 0<br />
Performance indicators<br />
School category<br />
Enrolment*<br />
P. only P + UP P+sec/hs U.P. only UP+Sec Grade 2004-05 2005-06 2006-07 2007-08 2008-09<br />
% Single-classroom schools<br />
3.9 0.5 0.1 0.0 0.4 I 163,011 175,939 196,160 179,578 177,937<br />
% Single-teacher schools<br />
20.1 1.2 0.0 7.7 0.8 <strong>II</strong> 120,232 128,209 141,360 145,680 152,286<br />
% Schools with SCR > 60<br />
4.3 3.4 1.6 0.0 1.0 <strong>II</strong>I 101,367 103,599 117,413 126,561 133,986<br />
% Schools with pre-primary sections 6.8 28.4 59.7 0.0 0.4 IV 90,583 94,018 102,814 111,524 119,114<br />
% Schools with common toilets 31.1 56.1 77.8 46.2 64.1 V 86,449 92,708 101,863 106,460 113,342<br />
% Schools with girls toilets 66.1 89.8 98.7 84.6 84.8 VI 76,687 84,647 99,045 107,305 110,263<br />
% Schools with drinking water facility 87.7 96.7 99.5 100.0 98.2 V<strong>II</strong> 60,381 73,336 88,354 99,671 105,028<br />
% Schools with blackboard<br />
100.0 100.0 100.0 100.0 100.0 V<strong>II</strong>I 58,619 67,221 92,344 104,924 118,968<br />
% Enrolment in Govt. schools 88.8 54.1 11.8 49.5 87.4 Total Pr. 561,642 594,473 659,610 669,803 696,665<br />
% Enrolment in single-teacher schools 14.3 0.5 0.0 8.4 0.7 Total U.P 195,687 225,204 279,743 311,900 334,259<br />
% No female teacher schools (tch>=2) 26.7 26.7 19.6 15.4 40.0 Transition rate (Primary to Upper Primay)<br />
98.5<br />
% Govt. schools with kitchen-shed 30.6 38.0 43.6 75.0 13.4 Retention rate<br />
% Govt. schools opened since 2003 18.2 4.8 1.3 75.0 4.3 (Primary level)<br />
/ NER<br />
GER<br />
SC, ST & OBC Enrolment Primary Upper<br />
Muslim Enrolment<br />
68.6<br />
2006-07 2007-08 2008-09<br />
primary<br />
Primary U.Primary Gender Parity Index GER (Primary) 93.0 95.0 100.4<br />
% SC enrolment<br />
% SC girls to SC enrolment<br />
% ST enrolment<br />
% ST girls to ST enrolment<br />
% OBC enrolment<br />
% OBC girls to OBC enr.<br />
Indicators<br />
% Girls<br />
Pupil-teacher ratio (PTR)<br />
Student-classroom ratio (SCR)<br />
% Schools with 100<br />
% Female teachers<br />
% Schools established since 1995<br />
Classrooms/Other rooms<br />
18.9 16.4<br />
NER (Primary)<br />
% Muslim<br />
Primary level<br />
47.1 43.1<br />
7.6 4.8<br />
GER(U.Prim)<br />
11.3 10.8 Enrolment<br />
0.91 NER(U.Prim)<br />
47.6 42.4<br />
% Muslim girls to<br />
48.3 44.8<br />
Flow rates<br />
43.7 45.2<br />
48.0 44.9 Muslim Enrolment<br />
Grade R.R. D.O.R. P.R. Grade<br />
School category<br />
I 9.4 10.7 79.9 I<br />
P. only P + UP P+sec/hs U.P. only UP+Sec <strong>II</strong> 6.1 4.6 89.4 <strong>II</strong><br />
50.7 47.8 42.4 66.1 47.7 <strong>II</strong>I 3.0 4.3 92.7 <strong>II</strong>I<br />
28 24 28 17 18 IV 1.7<br />
IV<br />
26 24 23 17 16 V 1.5 0.1 98.5 V<br />
41.2 5.2 1.3 46.2 14.1 I - V 4.9 4.4 90.7 VI<br />
1.2 0.4 0.7 0.0 0.6 VI 5.1 0.4 94.5 V<strong>II</strong><br />
46.8 38.6 35.8 59.7 33.3 V<strong>II</strong> 3.6<br />
V<strong>II</strong>I<br />
65.8 44.6 59.3 53.8 13.7 V<strong>II</strong>I 9.9 # # Total<br />
Classrooms<br />
School category<br />
Total<br />
classrooms<br />
% Good<br />
condition<br />
% Minor<br />
repairs<br />
% Major<br />
repairs<br />
Other<br />
rooms<br />
Primary only<br />
7,592 73.3 17.1 9.6 3,585<br />
Primary with Upper Primary<br />
18,953 83.3 11.5 5.1 6,581<br />
Primary with U.P. Sec/Hr. Sec. 13,630 94.2 4.6 1.2 4,620<br />
Upper Primary only<br />
62 93.5 6.5 0.0 44<br />
Upper Primary with Sec./H. Sec 3,240 75.9 17.1 7.0 2,955<br />
Position of teachers by educational qualification (Other than Contractual-teachers)<br />
School category<br />
Below<br />
Secondary Higher<br />
Secondary<br />
Secondary Graduate<br />
Primary only<br />
115 384 1,380 2,701<br />
Primary with Upper Primary<br />
327 713 2,716 9,009<br />
Primary with U. P. Sec/ Hr. Sec.<br />
119 224 1,027 6,428<br />
Upper Primary only<br />
0 1 2 26<br />
Upper Primary with Sec./Higher Secondary 28 86 250 1,218<br />
Contractual-teachers<br />
Gender & caste distribution of teachers*<br />
School category Avg. No. of Tchs.<br />
Primary only<br />
2.6<br />
Primary with Upper Prim.<br />
6.5<br />
Prim.with U.P.Sec/Hr.Sec<br />
8.9<br />
Upper Primary only<br />
4.8<br />
U. Primary with Sec./Hr.S<br />
5.8<br />
Enrolment by medium of instructions*<br />
67.0<br />
65.0<br />
46.0<br />
No. of schools by type of building*<br />
Post<br />
No<br />
Graduate M. Phil. Others response<br />
72.0<br />
73.0<br />
50.0<br />
91.4<br />
77.7<br />
58.5<br />
Enrolment<br />
All With disability<br />
Girls Boys Girls<br />
83,484 554 351<br />
73,246 482 357<br />
64,411 497 331<br />
56,942 457 321<br />
53,539 404 328<br />
50,505 239 160<br />
47,320 228 164<br />
51,687 263 196<br />
481,134 3,124 2,208<br />
Pucca<br />
Partially<br />
Multiple No<br />
Pucca Kuchcha Tent Type Building<br />
2,471 14 3 0 16 235<br />
2,815 11 1 0 75 27<br />
1,227 0 0 0 24 18<br />
12 0 0 0 0 1<br />
510 0 0 0 1 1<br />
2,140 25 5<br />
5,805 70 29 0<br />
3,322 42 10 0<br />
26 0 0 0<br />
1,347 13 1 0<br />
32 31 141 303 198 2 0 0<br />
Total<br />
Regular teachers Contractual-teachers SC teachers ST teachers<br />
Male Female No res Male Female No res Male Female Male Female<br />
7028 3547 3203 0 190 88 0 729 292 310 188<br />
18957 11474 7195 0 157 131 0 2072 670 1169 420<br />
11281 7185 3987 0 62 47 0 1050 240 463 122<br />
62 23 32 0 2 5 0 2 2 2 3<br />
2968 1966 977 0 14 11 0 317 62 154 34<br />
% Total Primary Upper Primary % Schools recvd.<br />
Grossness<br />
(Previous year)<br />
9.0<br />
24.8<br />
School T L M<br />
Urdu<br />
dev. grant grant<br />
Examination results<br />
(Previous academic year)<br />
Terminal % % Passed<br />
0 grade Passed with >60%<br />
V boys 98.6 57.8<br />
V girls 98.4 54.7<br />
V<strong>II</strong>I boys 82.0 63.8<br />
V<strong>II</strong>I girls 78.9 64.1<br />
%Teachers recvd.<br />
In-service training<br />
Male Female<br />
39.6 35.3<br />
23.7 24.7<br />
5.1 2.2<br />
48.0 10.8<br />
15.7 11.3<br />
Incentives : Number of beneficiaries<br />
(Previous academic year)<br />
Category<br />
P. only<br />
Hindi<br />
189785<br />
English<br />
3477<br />
702<br />
74.8 66.1<br />
Incentive<br />
Type<br />
P + UP<br />
455654<br />
7993<br />
0<br />
48.2 44.6 Text books<br />
P+sec/hs 283158 36016<br />
0<br />
10.2 8.5 Uniform<br />
U.P. only<br />
1053<br />
0<br />
0<br />
15.4 15.4 Attendance<br />
UP+Sec<br />
52726<br />
360<br />
0<br />
7.2 0.8 Stationery<br />
# = not applicable na = not available * Some totals may not match due to no response in classificatory data items<br />
Primary Upper primary<br />
Boys Girls Boys Girls<br />
167237 188267 71578 79495<br />
1066 993 842 945<br />
1010 1297 5516 4387<br />
24835 27789 6949 8811


