

Volume II - DISE
Volume II - DISE
Volume II - DISE

You also want an ePaper? Increase the reach of your titles
YUMPU automatically turns print PDFs into web optimized ePapers that Google loves.
District<br />
KEONJHAR<br />
State Orissa<br />
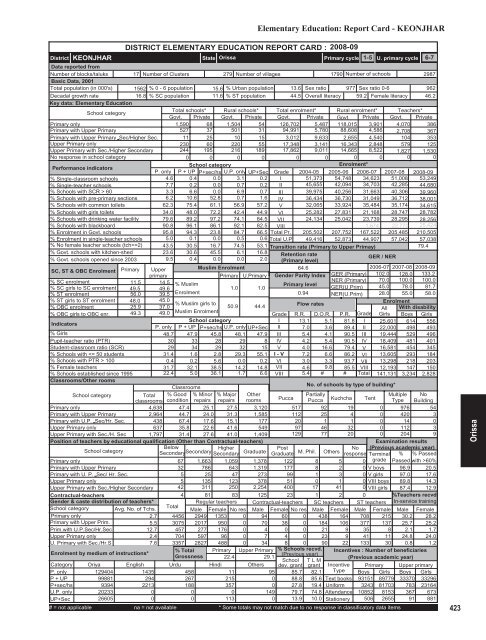
Elementary Education: Report Card - KEONJHAR<br />
DISTRICT ELEMENTARY EDUCATION REPORT CARD : 2008-09<br />
Primary cycle<br />
1-5 U. primary cycle 6-7<br />
Data reported from<br />
Number of blocks/taluks 17 Number of Clusters 279 Number of villages<br />
1790 Number of schools<br />
2987<br />
Basic Data, 2001<br />
Total population (in 000's) 1562 % 0 - 6 population 15.6 % Urban population 13.6 Sex ratio 977 Sex ratio 0-6<br />
962<br />
Decadal growth rate<br />
16.8 % SC population 11.6 % ST population 44.5 Overall literacy 59.2 Female literacy 46.2<br />
Key data: Elementary Education<br />
School category<br />
Total schools* Rural schools* Total enrolment* Rural enrolment* Teachers*<br />
Govt. Private Govt. Private Govt. Private Govt. Private Govt. Private<br />
Primary only<br />
1,590 68 1,504 54 126,702 5,487 118,015 3,901 4,070 386<br />
Primary with Upper Primary<br />
527 37 501 31 94,991 5,780 88,608 4,586 2,708 367<br />
Primary with Upper Primary Sec/Higher Sec. 11 25 10 15 3,012 9,633 2,655 4,540 104 353<br />
Upper Primary only<br />
230 60 220 55 17,348 3,141 16,343 2,848 579 125<br />
Upper Primary with Sec./Higher Secondary 244 195 216 189 17,862 9,011 14,665 8,522 1,827 1,530<br />
No response in school category<br />
0 0 0 0 0 0 0 0 0 0<br />
Performance indicators<br />
School category<br />
Enrolment*<br />
P. only P + UP P+sec/hs U.P. only UP+Sec Grade 2004-05 2005-06 2006-07 2007-08 2008-09<br />
% Single-classroom schools<br />
4.6 0.4 0.0 3.1 0.2 I 51,373 54,748 34,623 51,008 53,249<br />
% Single-teacher schools<br />
7.7 0.2 0.0 0.7 0.2 <strong>II</strong> 45,655 42,094 34,703 42,285 44,680<br />
% Schools with SCR > 60<br />
3.3 6.6 0.0 6.9 0.7 <strong>II</strong>I 39,975 40,256 31,663 40,306 39,960<br />
% Schools with pre-primary sections 6.2 10.6 52.8 0.7 1.6 IV 36,434 36,730 31,049 36,712 38,001<br />
% Schools with common toilets 62.3 75.4 61.1 56.9 57.2 V 32,065 33,924 35,484 35,174 34,615<br />
% Schools with girls toilets 34.0 48.0 72.2 42.4 44.9 VI 25,282 27,831 21,168 28,747 28,782<br />
% Schools with drinking water facility 79.6 89.2 97.2 74.1 84.5 V<strong>II</strong> 24,134 25,042 23,739 28,295 28,256<br />
% Schools with blackboard<br />
90.8 96.1 86.1 92.1 82.5 V<strong>II</strong>I<br />
1,674 22,770 25,424<br />
% Enrolment in Govt. schools 95.8 94.3 23.8 84.7 66.5 Total Pr. 205,502 207,752 167,522 205,485 210,505<br />
% Enrolment in single-teacher schools 5.0 0.1 0.0 0.5 0.6 Total U.P 49,416 52,873 44,907 57,042 57,038<br />
% No female teacher schools (tch>=2) 43.5 30.5 16.7 74.5 53.1 Transition rate (Primary to Upper Primay)<br />
79.4<br />
% Govt. schools with kitchen-shed 23.6 30.6 45.5 6.1 16.8 Retention rate<br />
% Govt. schools opened since 2003 9.5 0.4 0.0 0.0 2.0 (Primary level)<br />
/ NER<br />
GER<br />
SC, ST & OBC Enrolment Primary Upper<br />
Muslim Enrolment<br />
64.6<br />
2006-07 2007-08 2008-09<br />
primary<br />
Primary U.Primary Gender Parity Index GER (Primary) 102.0 128.0 133.2<br />
% SC enrolment<br />
% SC girls to SC enrolment<br />
% ST enrolment<br />
% ST girls to ST enrolment<br />
% OBC enrolment<br />
% OBC girls to OBC enr.<br />
Indicators<br />
% Girls<br />
Pupil-teacher ratio (PTR)<br />
Student-classroom ratio (SCR)<br />
% Schools with 100<br />
% Female teachers<br />
% Schools established since 1995<br />
Classrooms/Other rooms<br />
11.5 14.5 % Muslim<br />
Primary level<br />
49.5 49.6<br />
1.0 1.0<br />
56.0 39.5 Enrolment<br />
0.94<br />
48.0 45.0<br />
% Muslim girls to<br />
50.9 44.4<br />
Flow rates<br />
25.9 37.0<br />
49.3 49.0 Muslim Enrolment<br />
Grade<br />
School category<br />
I<br />
P. only P + UP P+sec/hs U.P. only UP+Sec <strong>II</strong><br />
48.7 47.9 45.8 48.1 47.9 <strong>II</strong>I<br />
30 33 28 29 8 IV<br />
29 34 29 32 15 V 4.0<br />
31.4 1.6 2.8 29.3 55.1 I - V 7.2<br />
0.4 0.2 5.6 0.0 0.2 VI 3.0<br />
31.7 32.1 38.5 14.2 14.8 V<strong>II</strong> 4.6<br />
22.4 5.0 36.1 1.7 6.6 V<strong>II</strong>I 5.4<br />
Classrooms<br />
School category<br />
Total<br />
classrooms<br />
% Good<br />
condition<br />
% Minor<br />
repairs<br />
% Major<br />
repairs<br />
Other<br />
rooms<br />
Primary only<br />
4,638 47.4 25.1 27.5 3,120<br />
Primary with Upper Primary<br />
2,964 44.7 24.0 31.3 1,585<br />
Primary with U.P. Sec/Hr. Sec.<br />
438 67.4 17.6 15.1 177<br />
Upper Primary only<br />
637 35.8 22.6 41.6 549<br />
Upper Primary with Sec./H. Sec 1,797 31.4 27.6 41.0 1,409<br />
Position of teachers by educational qualification (Other than Contractual-teachers)<br />
School category<br />
Below<br />
Secondary Higher<br />
Secondary<br />
Secondary Graduate<br />
Primary only<br />
67 1,663 1,059 1,378<br />
Primary with Upper Primary<br />
32 786 643 1,319<br />
Primary with U. P. Sec/ Hr. Sec.<br />
5 25 47 273<br />
Upper Primary only<br />
5 135 123 378<br />
Upper Primary with Sec./Higher Secondary 42 311 250 2,254<br />
Contractual-teachers<br />
Gender & caste distribution of teachers*<br />
School category Avg. No. of Tchs.<br />
Primary only<br />
2.7<br />
Primary with Upper Prim.<br />
5.5<br />
Prim.with U.P.Sec/Hr.Sec<br />
12.7<br />
Upper Primary only<br />
2.4<br />
U. Primary with Sec./Hr.S<br />
7.6<br />
Enrolment by medium of instructions*<br />
NER (Primary)<br />
GER(U.Prim)<br />
NER(U.Prim)<br />
Grade<br />
5.1 81.8 I<br />
3.6 89.4 <strong>II</strong><br />
4.1 90.5 <strong>II</strong>I<br />
5.4 90.5 IV<br />
16.6 79.4 V<br />
6.6 86.2 VI<br />
3.3 93.7 V<strong>II</strong><br />
9.8 85.5 V<strong>II</strong>I<br />
# # Total<br />
R.R. D.O.R. P.R.<br />
13.1<br />
7.0<br />
5.4<br />
4.2<br />
70.0<br />
45.0<br />
28.0<br />
No. of schools by type of building*<br />
Post<br />
No<br />
Graduate M. Phil. Others response<br />
100.0<br />
78.0<br />
55.0<br />
100.0<br />
81.7<br />
58.0<br />
Enrolment<br />
All With disability<br />
Girls Boys Girls<br />
25,601 614 556<br />
22,000 498 493<br />
19,444 529 496<br />
18,409 481 401<br />
16,581 454 345<br />
13,605 293 184<br />
13,298 218 203<br />
12,193 147 150<br />
141,131 3,234 2,828<br />
Pucca<br />
Partially<br />
Multiple No<br />
Pucca Kuchcha Tent Type Building<br />
517 92 19 0 976 54<br />
112 25 4 0 420 3<br />
20 1 1 0 14 0<br />
97 46 32 0 112 3<br />
129 77 20 0 204 9<br />
122 8 5<br />
177 8 2 0<br />
99 1 3 0<br />
51 0 1 0<br />
400 17 41 0<br />
4 81 83 125 23 1 2 0<br />
Total<br />
Regular teachers Contractual-teachers SC teachers ST teachers<br />
Male Female No res Male Female No res Male Female Male Female<br />
4456 2949 1353 0 94 60 0 438 164 708 215<br />
3075 2017 950 0 70 38 0 184 106 377 137<br />
457 277 176 0 4 0 0 21 9 35 8<br />
704 597 96 0 7 4 0 23 9 41 11<br />
3357 2827 488 0 34 8 0 90 22 133 30<br />
% Total Primary Upper Primary % Schools recvd.<br />
Grossness<br />
(Previous year)<br />
22.4<br />
29.1<br />
School T L M<br />
Urdu<br />
Hindi Others dev. grant grant<br />
Examination results<br />
(Previous academic year)<br />
Terminal % % Passed<br />
0 grade Passed with >60%<br />
V boys 96.9 20.5<br />
V girls 97.0 17.6<br />
V<strong>II</strong>I boys 89.8 14.3<br />
V<strong>II</strong>I girls 87.4 12.9<br />
%Teachers recvd.<br />
In-service training<br />
Male Female<br />
30.2 28.2<br />
25.7 25.2<br />
2.1 1.7<br />
24.8 24.0<br />
0.8 1.2<br />
Incentives : Number of beneficiaries<br />
(Previous academic year)<br />
Category<br />
P. only<br />
Oriya<br />
129404<br />
English<br />
1435<br />
458<br />
11<br />
95 85.7 82.1<br />
Incentive<br />
Type<br />
P + UP<br />
99881<br />
294<br />
267<br />
215<br />
0 88.8 85.6 Text books<br />
P+sec/hs<br />
9394<br />
2213<br />
188<br />
357<br />
0 27.8 19.4 Uniform<br />
U.P. only 20233<br />
0<br />
0<br />
0<br />
149 79.7 74.8 Attendance<br />
UP+Sec<br />
26605<br />
0<br />
0<br />
113<br />
0 13.9 10.0 Stationery<br />
# = not applicable na = not available * Some totals may not match due to no response in classificatory data items<br />
Primary Upper primary<br />
Boys Girls Boys Girls<br />
93151 89779 33370 33296<br />
3243 81703 783 23164<br />
10852 8153 367 673<br />
506 2655 91 881<br />
423<br />
Orissa


