

Volume II - DISE
Volume II - DISE
Volume II - DISE

You also want an ePaper? Increase the reach of your titles
YUMPU automatically turns print PDFs into web optimized ePapers that Google loves.
District<br />
SIDDHARTHNAGAR<br />
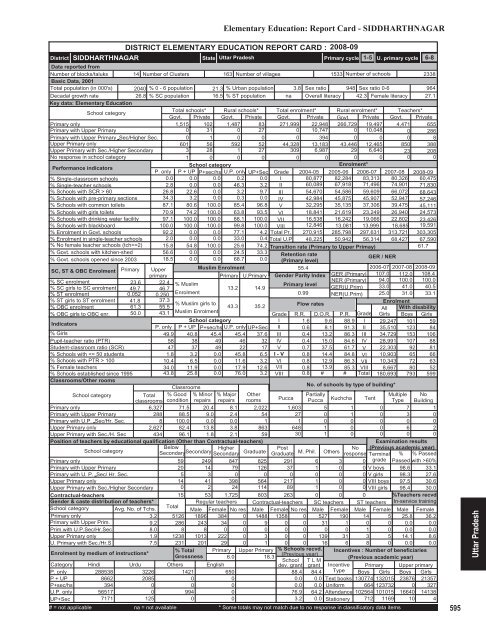
Elementary Education: Report Card - SIDDHARTHNAGAR<br />
DISTRICT ELEMENTARY EDUCATION REPORT CARD : 2008-09<br />
State Uttar Pradesh<br />
Primary cycle<br />
1-5 U. primary cycle 6-8<br />
Data reported from<br />
Number of blocks/taluks 14 Number of Clusters 163 Number of villages<br />
1533 Number of schools<br />
2338<br />
Basic Data, 2001<br />
Total population (in 000's) 2040 % 0 - 6 population 21.3 % Urban population 3.8 Sex ratio 948 Sex ratio 0-6<br />
964<br />
Decadal growth rate<br />
26.8 % SC population 16.5 % ST population na Overall literacy 42.3 Female literacy 27.1<br />
Key data: Elementary Education<br />
School category<br />
Total schools* Rural schools* Total enrolment* Rural enrolment* Teachers*<br />
Govt. Private Govt. Private Govt. Private Govt. Private Govt. Private<br />
Primary only<br />
1,515 102 1,487 83 271,999 22,948 266,729 19,497 4,471 655<br />
Primary with Upper Primary<br />
0 31 0 27 0 10,747 0 10,048 0 286<br />
Primary with Upper Primary Sec/Higher Sec.<br />
0 1 0 0 0 394 0 0 0 8<br />
Upper Primary only<br />
601 56 592 52 44,328 13,183 43,446 12,465 850 388<br />
Upper Primary with Sec./Higher Secondary<br />
3 28 1 27 309 6,987 29 6,640 23 208<br />
No response in school category<br />
1 0 0 0 0 0 0 0 0 0<br />
Performance indicators<br />
School category<br />
Enrolment*<br />
P. only P + UP P+sec/hs U.P. only UP+Sec Grade 2004-05 2005-06 2006-07 2007-08 2008-09<br />
% Single-classroom schools<br />
0.0 0.0 0.0 0.2 0.0 I 80,877 82,284 83,313 80,326 60,475<br />
% Single-teacher schools<br />
2.8 0.0 0.0 46.3 3.2 <strong>II</strong> 60,089 67,918 71,496 74,901 71,830<br />
% Schools with SCR > 60<br />
26.8 22.6 0.0 3.2 9.7 <strong>II</strong>I 54,670 54,586 59,609 66,072 68,643<br />
% Schools with pre-primary sections 34.3 3.2 0.0 0.3 0.0 IV 42,984 45,875 45,907 52,947 57,246<br />
% Schools with common toilets 87.1 80.6 100.0 85.4 96.8 V 32,295 35,135 37,306 39,475 45,111<br />
% Schools with girls toilets 70.9 74.2 100.0 63.8 93.5 VI 18,841 21,619 23,249 26,940 24,573<br />
% Schools with drinking water facility 97.1 100.0 100.0 88.1 100.0 V<strong>II</strong> 16,538 16,242 19,066 22,802 23,426<br />
% Schools with blackboard<br />
100.0 100.0 100.0 99.8 100.0 V<strong>II</strong>I 12,846 13,081 13,999 18,685 19,591<br />
% Enrolment in Govt. schools 92.2 0.0 0.0 77.1 4.2 Total Pr. 270,915 285,798 297,631 313,721 303,305<br />
% Enrolment in single-teacher schools 2.0 0.0 0.0 33.0 0.4 Total U.P 48,225 50,942 56,314 68,427 67,590<br />
% No female teacher schools (tch>=2) 15.8 54.8 100.0 25.6 74.2 Transition rate (Primary to Upper Primay)<br />
61.7<br />
% Govt. schools with kitchen-shed 56.6 0.0 0.0 24.5 33.3 Retention rate<br />
% Govt. schools opened since 2003 18.5 0.0 0.0 68.7 0.0 (Primary level)<br />
/ NER<br />
GER<br />
SC, ST & OBC Enrolment Primary Upper<br />
Muslim Enrolment<br />
55.4<br />
2006-07 2007-08 2008-09<br />
primary<br />
Primary U.Primary Gender Parity Index GER (Primary) 107.0 112.0 108.4<br />
% SC enrolment<br />
% SC girls to SC enrolment<br />
% ST enrolment<br />
% ST girls to ST enrolment<br />
% OBC enrolment<br />
% OBC girls to OBC enr.<br />
Indicators<br />
% Girls<br />
Pupil-teacher ratio (PTR)<br />
Student-classroom ratio (SCR)<br />
% Schools with 100<br />
% Female teachers<br />
% Schools established since 1995<br />
Classrooms/Other rooms<br />
23.6 22.4 % Muslim<br />
Primary level<br />
49.7 46.7<br />
13.2 14.9<br />
0.052 0.250<br />
Enrolment<br />
0.99<br />
41.8 37.3<br />
% Muslim girls to<br />
43.3 35.2<br />
Flow rates<br />
61.3 55.5<br />
50.0 43.1 Muslim Enrolment<br />
Grade<br />
School category<br />
I<br />
P. only P + UP P+sec/hs U.P. only UP+Sec <strong>II</strong><br />
49.9 40.8 45.4 45.4 37.6 <strong>II</strong>I<br />
58 38 49 46 32 IV<br />
47 37 49 22 17 V 0.7<br />
1.8 3.2 0.0 45.8 6.5 I - V 0.8<br />
10.4 6.5 0.0 11.6 3.2 VI 0.8<br />
34.0 11.9 0.0 17.9 12.6 V<strong>II</strong> 0.8<br />
43.8 25.8 0.0 76.0 3.2 V<strong>II</strong>I 0.8<br />
Classrooms<br />
School category<br />
Total<br />
classrooms<br />
% Good<br />
condition<br />
% Minor<br />
repairs<br />
% Major<br />
repairs<br />
Other<br />
rooms<br />
Primary only<br />
6,327 71.5 20.4 8.1 2,022<br />
Primary with Upper Primary<br />
288 88.5 9.0 2.4 54<br />
Primary with U.P. Sec/Hr. Sec.<br />
8 100.0 0.0 0.0<br />
1<br />
Upper Primary only<br />
2,627 82.4 13.8 3.8 863<br />
Upper Primary with Sec./H. Sec<br />
434 96.1 1.8 2.1 59<br />
Position of teachers by educational qualification (Other than Contractual-teachers)<br />
School category<br />
Below<br />
Secondary Higher<br />
Secondary<br />
Secondary Graduate<br />
Primary only<br />
59 249 847 825<br />
Primary with Upper Primary<br />
20 14 79 126<br />
Primary with U. P. Sec/ Hr. Sec.<br />
5 3 0 0<br />
Upper Primary only<br />
14 41 398 564<br />
Upper Primary with Sec./Higher Secondary<br />
0 2 24 114<br />
Contractual-teachers<br />
Gender & caste distribution of teachers*<br />
School category Avg. No. of Tchs.<br />
Primary only<br />
3.2<br />
Primary with Upper Prim.<br />
9.2<br />
Prim.with U.P.Sec/Hr.Sec<br />
8.0<br />
Upper Primary only<br />
1.9<br />
U. Primary with Sec./Hr.S<br />
7.5<br />
Enrolment by medium of instructions*<br />
NER (Primary)<br />
GER(U.Prim)<br />
NER(U.Prim)<br />
Grade<br />
9.6 88.9 I<br />
8.1 91.3 <strong>II</strong><br />
13.2 86.3 <strong>II</strong>I<br />
15.0 84.6 IV<br />
37.5 61.7 V<br />
14.4 84.8 VI<br />
12.9 86.3 V<strong>II</strong><br />
13.9 85.3 V<strong>II</strong>I<br />
# # Total<br />
R.R. D.O.R. P.R.<br />
1.6<br />
0.6<br />
0.4<br />
0.4<br />
94.0<br />
33.0<br />
25.0<br />
No. of schools by type of building*<br />
Post<br />
No<br />
Graduate M. Phil. Others response<br />
100.0<br />
41.0<br />
31.0<br />
100.0<br />
40.5<br />
33.1<br />
Enrolment<br />
All With disability<br />
Girls Boys Girls<br />
29,247 101 59<br />
35,510 123 84<br />
34,729 153 106<br />
28,991 107 88<br />
22,303 92 81<br />
10,903 65 66<br />
10,343 72 63<br />
8,667 80 52<br />
180,693 793 599<br />
Pucca<br />
Partially<br />
Multiple No<br />
Pucca Kuchcha Tent Type Building<br />
1,603 5 1 0 7 1<br />
27 0 1 0 3 0<br />
1 0 0 0 0 0<br />
648 1 0 0 6 2<br />
30 1 0 0 0 0<br />
291 6 3<br />
37 1 0 0<br />
0 0 0 0<br />
217 1 0 0<br />
89 1 0 0<br />
15 53 1,725 803 263 0 0 0<br />
Total<br />
Regular teachers Contractual-teachers SC teachers ST teachers<br />
Male Female No res Male Female No res Male Female Male Female<br />
5126 1896 384 0 1488 1358 0 527 190 14 5<br />
286 243 34 0 9 0 0 31 1 0 0<br />
8 8 0 0 0 0 0 0 0 1 0<br />
1238 1013 222 0 3 0 0 139 31 3 5<br />
231 201 29 0 1 0 0 16 6 8 0<br />
% Total Primary Upper Primary % Schools recvd.<br />
Grossness<br />
(Previous year)<br />
6.0<br />
18.3<br />
School T L M<br />
Others English<br />
dev. grant grant<br />
Examination results<br />
(Previous academic year)<br />
Terminal % % Passed<br />
0 grade Passed with >60%<br />
V boys 98.6 33.1<br />
V girls 98.3 27.6<br />
V<strong>II</strong>I boys 97.5 30.6<br />
V<strong>II</strong>I girls 98.4 30.0<br />
%Teachers recvd.<br />
In-service training<br />
Male Female<br />
25.8 36.2<br />
0.0 0.0<br />
0.0 0.0<br />
14.1 8.6<br />
0.0 0.0<br />
Incentives : Number of beneficiaries<br />
(Previous academic year)<br />
Category Hindi<br />
Urdu<br />
Incentive<br />
P. only<br />
288538<br />
3226<br />
1421<br />
650<br />
88.4 84.4 Type<br />
P + UP<br />
8662<br />
2085<br />
0<br />
0<br />
0.0 0.0 Text books<br />
P+sec/hs<br />
394<br />
0<br />
0<br />
0<br />
0.0 0.0 Uniform<br />
U.P. only 56517<br />
0<br />
994<br />
0<br />
76.9 64.2 Attendance<br />
UP+Sec<br />
7171<br />
125<br />
0<br />
0<br />
3.2 0.0 Stationery<br />
# = not applicable na = not available * Some totals may not match due to no response in classificatory data items<br />
Primary Upper primary<br />
Boys Girls Boys Girls<br />
130774 132015 23876 21357<br />
664 123732 0 327<br />
102564 101015 16640 14138<br />
712 1169 10 4<br />
595<br />
Uttar Pradesh


