

Volume II - DISE
Volume II - DISE
Volume II - DISE

You also want an ePaper? Increase the reach of your titles
YUMPU automatically turns print PDFs into web optimized ePapers that Google loves.
District<br />
MATHURA<br />
State Uttar Pradesh<br />
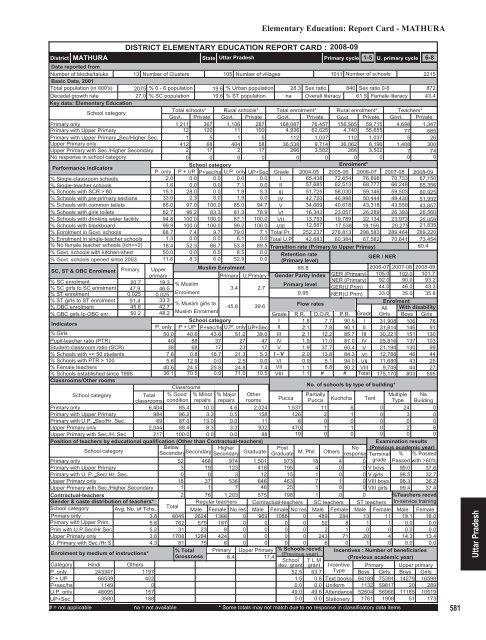
Elementary Education: Report Card - MATHURA<br />
DISTRICT ELEMENTARY EDUCATION REPORT CARD : 2008-09<br />
Primary cycle<br />
1-5 U. primary cycle 6-8<br />
Data reported from<br />
Number of blocks/taluks 13 Number of Clusters 105 Number of villages<br />
1011 Number of schools<br />
2215<br />
Basic Data, 2001<br />
Total population (in 000's) 2075 % 0 - 6 population 19.6 % Urban population 28.3 Sex ratio 840 Sex ratio 0-6<br />
872<br />
Decadal growth rate<br />
27.0 % SC population 19.6 % ST population na Overall literacy 61.5 Female literacy 43.4<br />
Key data: Elementary Education<br />
School category<br />
Total schools* Rural schools* Total enrolment* Rural enrolment* Teachers*<br />
Govt. Private Govt. Private Govt. Private Govt. Private Govt. Private<br />
Primary only<br />
1,211 367 1,106 287 168,087 76,457 156,565 59,715 4,698 1,347<br />
Primary with Upper Primary<br />
12 120 11 100 4,936 62,025 4,740 55,655 77 685<br />
Primary with Upper Primary Sec/Higher Sec.<br />
1 5 1 5 112 1,037 112 1,037 5 26<br />
Upper Primary only<br />
412 68 404 58 36,538 9,714 36,062 8,196 1,408 300<br />
Upper Primary with Sec./Higher Secondary<br />
2 17 2 17 266 3,502 266 3,502 7 74<br />
No response in school category<br />
0 0 0 0 0 0 0 0 0 0<br />
Performance indicators<br />
School category<br />
Enrolment*<br />
P. only P + UP P+sec/hs U.P. only UP+Sec Grade 2004-05 2005-06 2006-07 2007-08 2008-09<br />
% Single-classroom schools<br />
2.0 0.0 0.0 0.0 0.0 I 65,438 72,654 76,898 70,733 67,150<br />
% Single-teacher schools<br />
1.6 0.0 0.0 7.1 0.0 <strong>II</strong> 57,685 62,513 68,777 66,248 65,356<br />
% Schools with SCR > 60<br />
15.1 28.0 0.0 1.9 5.3 <strong>II</strong>I 51,725 56,030 59,146 59,503 60,925<br />
% Schools with pre-primary sections 33.0 2.3 0.0 1.9 0.0 IV 42,720 46,998 50,444 49,430 51,932<br />
% Schools with common toilets 86.0 97.0 100.0 85.0 94.7 V 34,669 40,618 43,318 43,550 43,857<br />
% Schools with girls toilets 82.7 96.2 83.3 81.3 78.9 VI 16,343 23,057 26,289 26,393 26,560<br />
% Schools with drinking water facility 94.8 100.0 100.0 87.1 100.0 V<strong>II</strong> 13,753 19,789 22,134 23,973 25,059<br />
% Schools with blackboard<br />
99.9 100.0 100.0 99.2 100.0 V<strong>II</strong>I 12,587 17,538 19,159 20,275 21,835<br />
% Enrolment in Govt. schools 68.7 7.4 9.7 79.0 7.1 Total Pr. 252,237 278,813 298,583 289,464 289,220<br />
% Enrolment in single-teacher schools 1.3 0.0 0.0 6.1 0.0 Total U.P 42,683 60,384 67,582 70,641 73,454<br />
% No female teacher schools (tch>=2) 18.4 52.3 66.7 53.8 89.5 Transition rate (Primary to Upper Primay)<br />
60.4<br />
% Govt. schools with kitchen-shed 50.0 0.0 0.0 8.5 0.0 Retention rate<br />
% Govt. schools opened since 2003 11.6 8.3 0.0 52.9 0.0 (Primary level)<br />
/ NER<br />
GER<br />
SC, ST & OBC Enrolment Primary Upper<br />
Muslim Enrolment<br />
65.8<br />
2006-07 2007-08 2008-09<br />
primary<br />
Primary U.Primary Gender Parity Index GER (Primary) 105.0 102.0 101.7<br />
% SC enrolment<br />
% SC girls to SC enrolment<br />
% ST enrolment<br />
% ST girls to ST enrolment<br />
% OBC enrolment<br />
% OBC girls to OBC enr.<br />
Indicators<br />
% Girls<br />
Pupil-teacher ratio (PTR)<br />
Student-classroom ratio (SCR)<br />
% Schools with 100<br />
% Female teachers<br />
% Schools established since 1995<br />
Classrooms/Other rooms<br />
20.7 19.3 % Muslim<br />
Primary level<br />
47.9 46.5<br />
3.4 2.7<br />
0.025 0.025<br />
Enrolment<br />
0.95<br />
51.4 33.3<br />
% Muslim girls to<br />
45.8 39.6<br />
Flow rates<br />
45.6 42.7<br />
50.2 48.2 Muslim Enrolment<br />
Grade<br />
School category<br />
I<br />
P. only P + UP P+sec/hs U.P. only UP+Sec <strong>II</strong><br />
50.0 40.6 43.6 51.2 39.0 <strong>II</strong>I<br />
40 88 37 27 47 IV<br />
38 68 17 23 17 V 1.9<br />
7.8 0.8 16.7 21.3 5.3 I - V 2.0<br />
5.6 12.9 0.0 2.5 0.0 VI 0.9<br />
40.6 24.5 25.8 24.8 7.4 V<strong>II</strong> 1.1<br />
36.1 70.5 0.0 71.0 10.5 V<strong>II</strong>I 1.1<br />
Classrooms<br />
School category<br />
Total<br />
classrooms<br />
% Good<br />
condition<br />
% Minor<br />
repairs<br />
% Major<br />
repairs<br />
Other<br />
rooms<br />
Primary only<br />
6,404 85.4 10.0 4.6 2,024<br />
Primary with Upper Primary<br />
984 96.2 3.3 0.5 158<br />
Primary with U.P. Sec/Hr. Sec.<br />
69 87.0 13.0 0.0 11<br />
Upper Primary only<br />
2,044 88.4 8.3 3.3 932<br />
Upper Primary with Sec./H. Sec<br />
217 100.0 0.0 0.0 88<br />
Position of teachers by educational qualification (Other than Contractual-teachers)<br />
School category<br />
Below<br />
Secondary Higher<br />
Secondary<br />
Secondary Graduate<br />
Primary only<br />
52 468 974 1,501<br />
Primary with Upper Primary<br />
3 19 123 418<br />
Primary with U. P. Sec/ Hr. Sec.<br />
0 0 3 12<br />
Upper Primary only<br />
18 37 536 646<br />
Upper Primary with Sec./Higher Secondary<br />
1 1 7 46<br />
Contractual-teachers<br />
Gender & caste distribution of teachers*<br />
School category Avg. No. of Tchs.<br />
Primary only<br />
3.8<br />
Primary with Upper Prim.<br />
5.8<br />
Prim.with U.P.Sec/Hr.Sec<br />
5.2<br />
Upper Primary only<br />
3.6<br />
U. Primary with Sec./Hr.S<br />
4.3<br />
Enrolment by medium of instructions*<br />
NER (Primary)<br />
GER(U.Prim)<br />
NER(U.Prim)<br />
Grade<br />
7.7 90.5 I<br />
7.8 90.1 <strong>II</strong><br />
12.2 85.7 <strong>II</strong>I<br />
11.0 87.0 IV<br />
37.7 60.4 V<br />
13.8 84.3 VI<br />
5.1 94.0 V<strong>II</strong><br />
8.8 90.2 V<strong>II</strong>I<br />
# # Total<br />
R.R. D.O.R. P.R.<br />
1.8<br />
2.1<br />
2.1<br />
1.9<br />
92.0<br />
44.0<br />
33.0<br />
No. of schools by type of building*<br />
Post<br />
No<br />
Graduate M. Phil. Others response<br />
90.0<br />
46.0<br />
35.0<br />
93.2<br />
43.3<br />
35.8<br />
Enrolment<br />
All With disability<br />
Girls Boys Girls<br />
31,908 106 76<br />
31,814 146 91<br />
30,221 151 130<br />
25,816 137 103<br />
21,194 130 99<br />
12,788 46 44<br />
11,680 43 25<br />
9,749 44 27<br />
175,170 803 595<br />
Pucca<br />
Partially<br />
Multiple No<br />
Pucca Kuchcha Tent Type Building<br />
1,537 11 6 0 24 0<br />
126 2 1 0 3 0<br />
6 0 0 0 0 0<br />
470 1 1 0 2 6<br />
19 0 0 0 0 0<br />
973 18 4<br />
195 4 0 0<br />
15 1 0 0<br />
463 7 1 0<br />
25 1 0 0<br />
2 76 1,203 575 198 1 0 0<br />
Total<br />
Regular teachers Contractual-teachers SC teachers ST teachers<br />
Male Female No res Male Female No res Male Female Male Female<br />
6045 2624 1366 0 969 1086 0 489 284 13 11<br />
762 575 187 0 0 0 0 52 8 1 1<br />
31 23 8 0 0 0 0 2 1 0 0<br />
1708 1284 424 0 0 0 0 243 71 20 4<br />
81 75 6 0 0 0 0 6 0 1 0<br />
% Total Primary Upper Primary % Schools recvd.<br />
Grossness<br />
(Previous year)<br />
8.4<br />
17.4<br />
School T L M<br />
dev. grant grant<br />
Examination results<br />
(Previous academic year)<br />
Terminal % % Passed<br />
0 grade Passed with >60%<br />
V boys 99.0 37.6<br />
V girls 98.5 32.7<br />
V<strong>II</strong>I boys 98.3 36.2<br />
V<strong>II</strong>I girls 99.4 37.4<br />
%Teachers recvd.<br />
In-service training<br />
Male Female<br />
19.1 18.0<br />
0.0 0.0<br />
0.0 0.0<br />
14.3 13.4<br />
0.0 0.0<br />
Incentives : Number of beneficiaries<br />
(Previous academic year)<br />
Category<br />
P. only<br />
Hindi<br />
243347<br />
Others<br />
1197<br />
52.5 53.7<br />
Incentive<br />
Type<br />
P + UP<br />
66539<br />
422<br />
1.5 0.8 Text books<br />
P+sec/hs<br />
1149<br />
0<br />
0.0 0.0 Uniform<br />
U.P. only 46095<br />
157<br />
49.0 49.6 Attendance<br />
UP+Sec<br />
3580<br />
188<br />
0.0 0.0 Stationery<br />
# = not applicable na = not available * Some totals may not match due to no response in classificatory data items<br />
Primary Upper primary<br />
Boys Girls Boys Girls<br />
64189 75391 14279 16599<br />
1132 59817 20 289<br />
52604 56966 11185 10519<br />
1761 1908 51 173<br />
581<br />
Uttar Pradesh


