

Volume II - DISE
Volume II - DISE
Volume II - DISE

Create successful ePaper yourself
Turn your PDF publications into a flip-book with our unique Google optimized e-Paper software.
Orissa<br />
434<br />
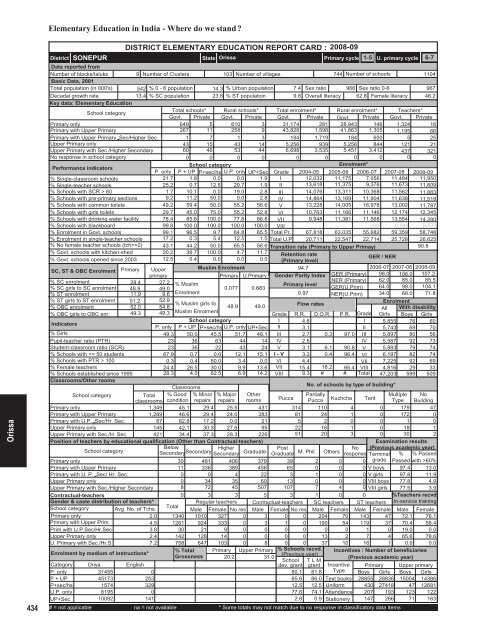
Elementary Education in India - Where do we stand <br />
District<br />
SONEPUR<br />
DISTRICT ELEMENTARY EDUCATION REPORT CARD : 2008-09<br />
State Orissa<br />
Primary cycle<br />
1-5 U. primary cycle 6-7<br />
Data reported from<br />
Number of blocks/taluks<br />
9 Number of Clusters 103 Number of villages<br />
744 Number of schools<br />
1104<br />
Basic Data, 2001<br />
Total population (in 000's) 542 % 0 - 6 population 14.3 % Urban population 7.4 Sex ratio 966 Sex ratio 0-6<br />
967<br />
Decadal growth rate<br />
13.4 % SC population 23.6 % ST population<br />
9.8 Overall literacy 62.8 Female literacy 46.2<br />
Key data: Elementary Education<br />
School category<br />
Total schools* Rural schools* Total enrolment* Rural enrolment* Teachers*<br />
Govt. Private Govt. Private Govt. Private Govt. Private Govt. Private<br />
Primary only<br />
649 5 610 3 31,174 281 28,943 146 1,324 16<br />
Primary with Upper Primary<br />
267 11 258 9 43,828 1,598 41,863 1,305 1,195 66<br />
Primary with Upper Primary Sec/Higher Sec.<br />
1 7 1 3 184 1,719 184 600 5 25<br />
Upper Primary only<br />
43 15 43 14 5,256 939 5,256 844 121 21<br />
Upper Primary with Sec./Higher Secondary<br />
60 46 53 44 6,698 3,535 5,451 3,412 437 321<br />
No response in school category<br />
0 0 0 0 0 0 0 0 0 0<br />
Performance indicators<br />
School category<br />
Enrolment*<br />
P. only P + UP P+sec/hs U.P. only UP+Sec Grade 2004-05 2005-06 2006-07 2007-08 2008-09<br />
% Single-classroom schools<br />
21.7 1.8 0.0 0.0 1.9 I 12,032 11,175 7,056 11,484 11,950<br />
% Single-teacher schools<br />
25.2 0.7 12.5 20.7 1.9 <strong>II</strong> 13,618 11,375 9,376 11,673 11,609<br />
% Schools with SCR > 60<br />
1.7 10.1 0.0 19.0 2.8 <strong>II</strong>I 14,076 13,311 10,368 11,562 11,883<br />
% Schools with pre-primary sections 9.2 11.2 50.0 0.0 2.8 IV 14,864 13,169 11,904 11,638 11,519<br />
% Schools with common toilets 49.2 59.4 50.0 55.2 56.6 V 13,228 14,005 16,978 13,002 11,787<br />
% Schools with girls toilets 29.7 45.0 75.0 55.2 52.8 VI 10,763 11,166 11,146 12,174 12,345<br />
% Schools with drinking water facility 78.4 85.6 100.0 77.6 86.8 V<strong>II</strong> 9,948 11,381 11,568 13,554 14,280<br />
% Schools with blackboard<br />
99.8 100.0 100.0 100.0 100.0 V<strong>II</strong>I<br />
390 8,988 9,839<br />
% Enrolment in Govt. schools 99.1 96.5 9.7 84.8 65.5 Total Pr. 67,818 63,035 55,682 59,359 58,748<br />
% Enrolment in single-teacher schools 17.2 0.3 5.4 12.5 1.5 Total U.P 20,711 22,547 22,714 25,728 26,625<br />
% No female teacher schools (tch>=2) 43.1 44.2 50.0 65.5 56.6 Transition rate (Primary to Upper Primay)<br />
90.8<br />
% Govt. schools with kitchen-shed 20.2 39.7 100.0 4.7 11.7 Retention rate<br />
% Govt. schools opened since 2003 12.5 0.4 0.0 0.0 0.0 (Primary level)<br />
/ NER<br />
GER<br />
SC, ST & OBC Enrolment Primary Upper<br />
Muslim Enrolment<br />
94.7<br />
2006-07 2007-08 2008-09<br />
primary<br />
Primary U.Primary Gender Parity Index GER (Primary) 98.0 106.0 107.2<br />
% SC enrolment<br />
% SC girls to SC enrolment<br />
% ST enrolment<br />
% ST girls to ST enrolment<br />
% OBC enrolment<br />
% OBC girls to OBC enr.<br />
Indicators<br />
% Girls<br />
Pupil-teacher ratio (PTR)<br />
Student-classroom ratio (SCR)<br />
% Schools with 100<br />
% Female teachers<br />
% Schools established since 1995<br />
Classrooms/Other rooms<br />
28.4 27.2<br />
NER (Primary)<br />
% Muslim<br />
Primary level<br />
48.9 49.0<br />
0.077 0.683<br />
GER(U.Prim)<br />
11.9 9.6 Enrolment<br />
0.97 NER(U.Prim)<br />
51.2 52.9<br />
% Muslim girls to<br />
48.9 49.0<br />
Flow rates<br />
52.0 54.8<br />
49.3 49.3 Muslim Enrolment<br />
Grade R.R. D.O.R. P.R. Grade<br />
School category<br />
I 4.6<br />
I<br />
P. only P + UP P+sec/hs U.P. only UP+Sec <strong>II</strong> 3.1<br />
<strong>II</strong><br />
49.3 50.0 45.5 51.7 48.1 <strong>II</strong>I 2.7 0.3 97.0 <strong>II</strong>I<br />
23 36 63 44 14 IV 2.6<br />
IV<br />
23 36 22 43 24 V 3.1 6.1 90.8 V<br />
67.9 0.7 0.0 12.1 15.1 I - V 3.2 0.4 96.4 VI<br />
0.3 0.4 50.0 3.4 0.0 VI 4.4<br />
V<strong>II</strong><br />
24.4 26.5 30.0 9.9 13.6 V<strong>II</strong> 15.4 18.2 66.4 V<strong>II</strong>I<br />
28.3 4.0 62.5 6.9 14.2 V<strong>II</strong>I 9.3 # # Total<br />
Classrooms<br />
School category<br />
Total<br />
classrooms<br />
% Good<br />
condition<br />
% Minor<br />
repairs<br />
% Major<br />
repairs<br />
Other<br />
rooms<br />
Primary only<br />
1,349 45.1 29.4 25.5 431<br />
Primary with Upper Primary<br />
1,269 46.6 29.4 24.0 383<br />
Primary with U.P. Sec/Hr. Sec.<br />
87 82.8 17.2 0.0 21<br />
Upper Primary only<br />
145 42.1 30.3 27.6 95<br />
Upper Primary with Sec./H. Sec<br />
421 34.4 37.3 28.3 226<br />
Position of teachers by educational qualification (Other than Contractual-teachers)<br />
School category<br />
Below<br />
Secondary Higher<br />
Secondary<br />
Secondary Graduate<br />
Primary only<br />
30 481 406 379<br />
Primary with Upper Primary<br />
11 336 389 456<br />
Primary with U. P. Sec/ Hr. Sec.<br />
0 0 4 22<br />
Upper Primary only<br />
0 34 35 60<br />
Upper Primary with Sec./Higher Secondary<br />
8 72 45 507<br />
Contractual-teachers<br />
Gender & caste distribution of teachers*<br />
School category Avg. No. of Tchs.<br />
Primary only<br />
2.0<br />
Primary with Upper Prim.<br />
4.5<br />
Prim.with U.P.Sec/Hr.Sec<br />
3.8<br />
Upper Primary only<br />
2.4<br />
U. Primary with Sec./Hr.S<br />
7.2<br />
Enrolment by medium of instructions*<br />
62.0<br />
64.0<br />
34.0<br />
No. of schools by type of building*<br />
Post<br />
No<br />
Graduate M. Phil. Others response<br />
85.0<br />
98.0<br />
68.0<br />
85.5<br />
104.1<br />
71.8<br />
Enrolment<br />
All With disability<br />
Girls Boys Girls<br />
5,855 76 60<br />
5,743 69 70<br />
5,897 80 56<br />
5,587 92 73<br />
5,883 79 74<br />
6,197 82 74<br />
7,225 92 69<br />
4,816 29 33<br />
47,203 599 509<br />
Pucca<br />
Partially<br />
Multiple No<br />
Pucca Kuchcha Tent Type Building<br />
314 110 4 0 179 47<br />
81 24 1 0 172 0<br />
5 2 0 0 1 0<br />
22 16 1 0 18 1<br />
51 20 3 0 30 2<br />
39 2 0<br />
65 0 0 0<br />
3 1 0 0<br />
13 0 0 0<br />
107 7 4 0<br />
0 3 3 5 3 1 0 0<br />
Total<br />
Regular teachers Contractual-teachers SC teachers ST teachers<br />
Male Female No res Male Female No res Male Female Male Female<br />
1340 1010 327 0 3 0 0 204 70 143 47<br />
1261 924 333 0 3 1 0 190 54 119 37<br />
30 21 9 0 0 0 0 0 0 1 0<br />
142 128 14 0 0 0 0 13 2 7 4<br />
758 647 103 0 8 0 0 37 10 16 1<br />
% Total Primary Upper Primary % Schools recvd.<br />
Grossness<br />
(Previous year)<br />
20.2<br />
31.0<br />
School T L M<br />
dev. grant grant<br />
Examination results<br />
(Previous academic year)<br />
Terminal % % Passed<br />
0 grade Passed with >60%<br />
V boys 97.4 13.0<br />
V girls 97.8 11.9<br />
V<strong>II</strong>I boys 77.8 4.9<br />
V<strong>II</strong>I girls 77.5 3.9<br />
%Teachers recvd.<br />
In-service training<br />
Male Female<br />
72.1 76.1<br />
70.4 58.4<br />
19.0 0.0<br />
65.6 78.6<br />
0.0 0.0<br />
Incentives : Number of beneficiaries<br />
(Previous academic year)<br />
Category Oriya English<br />
Incentive<br />
P. only<br />
31455<br />
0<br />
80.1 81.8 Type<br />
P + UP<br />
45173<br />
253<br />
85.6 86.0 Text books<br />
P+sec/hs<br />
1574<br />
329<br />
12.5 12.5 Uniform<br />
U.P. only<br />
6195<br />
0<br />
77.6 74.1 Attendance<br />
UP+Sec<br />
10092<br />
141<br />
2.8 0.9 Stationery<br />
# = not applicable na = not available * Some totals may not match due to no response in classificatory data items<br />
Primary Upper primary<br />
Boys Girls Boys Girls<br />
28855 28836 15004 14386<br />
430 27418 47 12681<br />
207 193 123 122<br />
147 266 71 163


