

Volume II - DISE
Volume II - DISE
Volume II - DISE

You also want an ePaper? Increase the reach of your titles
YUMPU automatically turns print PDFs into web optimized ePapers that Google loves.
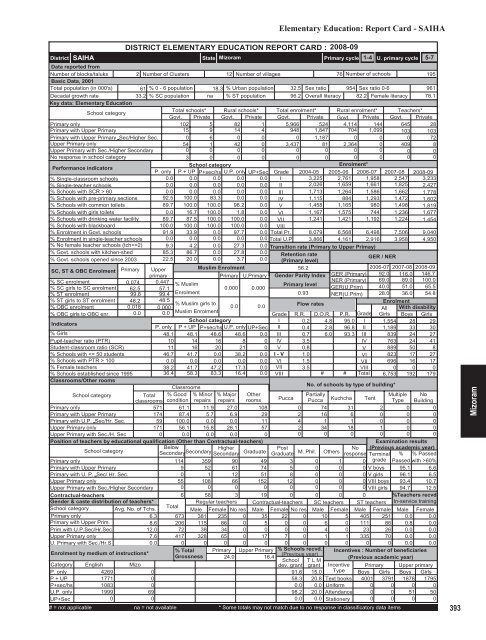
District<br />
SAIHA<br />
DISTRICT ELEMENTARY EDUCATION REPORT CARD : 2008-09<br />
State Mizoram<br />
Elementary Education: Report Card - SAIHA<br />
Primary cycle<br />
1-4 U. primary cycle 5-7<br />
Data reported from<br />
Number of blocks/taluks<br />
2 Number of Clusters 12 Number of villages<br />
76 Number of schools<br />
195<br />
Basic Data, 2001<br />
Total population (in 000's)<br />
61 % 0 - 6 population 18.3 % Urban population 32.5 Sex ratio 954 Sex ratio 0-6<br />
961<br />
Decadal growth rate<br />
33.2 % SC population na % ST population 96.2 Overall literacy 82.2 Female literacy 78.1<br />
Key data: Elementary Education<br />
School category<br />
Total schools* Rural schools* Total enrolment* Rural enrolment* Teachers*<br />
Govt. Private Govt. Private Govt. Private Govt. Private Govt. Private<br />
Primary only<br />
102 5 82 1 5,966 524 4,114 144 645 28<br />
Primary with Upper Primary<br />
15 9 14 4 948 1,847 704 1,099 103 103<br />
Primary with Upper Primary Sec/Higher Sec.<br />
0 6 0 0 0 1,187 0 0 0 72<br />
Upper Primary only<br />
54 1 42 0 3,437 81 2,364 0 409 8<br />
Upper Primary with Sec./Higher Secondary<br />
0 0 0 0 0 0 0 0 0 0<br />
No response in school category<br />
3 0 0 0 0 0 0 0 0 0<br />
Performance indicators<br />
School category<br />
Enrolment*<br />
P. only P + UP P+sec/hs U.P. only UP+Sec Grade 2004-05 2005-06 2006-07 2007-08 2008-09<br />
% Single-classroom schools<br />
0.0 0.0 0.0 0.0 0.0 I<br />
3,225 2,761 1,958 2,547 3,233<br />
% Single-teacher schools<br />
0.0 0.0 0.0 0.0 0.0 <strong>II</strong> 2,026 1,659 1,661 1,825 2,427<br />
% Schools with SCR > 60<br />
0.0 0.0 0.0 0.0 0.0 <strong>II</strong>I 1,713 1,264 1,586 1,662 1,778<br />
% Schools with pre-primary sections 92.5 100.0 83.3 0.0 0.0 IV 1,115 884 1,293 1,472 1,602<br />
% Schools with common toilets 89.7 100.0 100.0 98.2 0.0 V 1,458 1,165 980 1,498 1,819<br />
% Schools with girls toilets 0.0 16.7 100.0 1.8 0.0 VI 1,167 1,575 744 1,236 1,677<br />
% Schools with drinking water facility 89.7 87.5 100.0 100.0 0.0 V<strong>II</strong> 1,241 1,421 1,192 1,224 1,454<br />
% Schools with blackboard<br />
100.0 100.0 100.0 100.0 0.0 V<strong>II</strong>I<br />
% Enrolment in Govt. schools 91.9 33.9 0.0 97.7 0.0 Total Pr. 8,079 6,568 6,498 7,506 9,040<br />
% Enrolment in single-teacher schools 0.0 0.0 0.0 0.0 0.0 Total U.P 3,866 4,161 2,916 3,958 4,950<br />
% No female teacher schools (tch>=2) 9.3 4.2 0.0 27.3 0.0 Transition rate (Primary to Upper Primay)<br />
% Govt. schools with kitchen-shed 85.3 86.7 0.0 27.8 0.0 Retention rate<br />
% Govt. schools opened since 2003 22.5 20.0 0.0 3.7 0.0 (Primary level)<br />
/ NER<br />
GER<br />
SC, ST & OBC Enrolment Primary Upper<br />
Muslim Enrolment<br />
56.2<br />
2006-07 2007-08 2008-09<br />
primary<br />
Primary U.Primary Gender Parity Index GER (Primary) 92.0 116.0 146.7<br />
% SC enrolment<br />
% SC girls to SC enrolment<br />
% ST enrolment<br />
% ST girls to ST enrolment<br />
% OBC enrolment<br />
% OBC girls to OBC enr.<br />
Indicators<br />
% Girls<br />
Pupil-teacher ratio (PTR)<br />
Student-classroom ratio (SCR)<br />
% Schools with 100<br />
% Female teachers<br />
% Schools established since 1995<br />
Classrooms/Other rooms<br />
0.074 0.447<br />
NER (Primary) 69.0<br />
% Muslim<br />
Primary level<br />
62.5 57.1<br />
0.000 0.000<br />
GER(U.Prim) 40.0<br />
99.8 99.4 Enrolment<br />
0.93 NER(U.Prim) 28.0<br />
48.2 48.5<br />
% Muslim girls to<br />
0.0 0.0<br />
Flow rates<br />
0.018 0.000<br />
0.0 0.0 Muslim Enrolment<br />
Grade R.R. D.O.R. P.R. Grade<br />
School category<br />
I 0.2 4.8 95.0 I<br />
P. only P + UP P+sec/hs U.P. only UP+Sec <strong>II</strong> 0.4 2.8 96.8 <strong>II</strong><br />
48.1 48.1 48.6 48.6 0.0 <strong>II</strong>I 0.7 6.0 93.3 <strong>II</strong>I<br />
10 14 16 8 0 IV 3.5<br />
IV<br />
11 16 20 21 0 V 0.8<br />
V<br />
46.7 41.7 0.0 38.2 0.0 I - V 1.0<br />
VI<br />
0.0 0.0 0.0 0.0 0.0 VI 1.5<br />
V<strong>II</strong><br />
38.2 41.7 47.2 17.3 0.0 V<strong>II</strong> 3.5<br />
V<strong>II</strong>I<br />
36.4 58.3 83.3 16.4 0.0 V<strong>II</strong>I<br />
# # Total<br />
Classrooms<br />
School category<br />
Total<br />
classrooms<br />
% Good<br />
condition<br />
% Minor<br />
repairs<br />
% Major<br />
repairs<br />
Other<br />
rooms<br />
Primary only<br />
571 61.1 11.9 27.0 108<br />
Primary with Upper Primary<br />
174 87.4 5.7 6.9 29<br />
Primary with U.P. Sec/Hr. Sec.<br />
59 100.0 0.0 0.0 11<br />
Upper Primary only<br />
171 56.1 15.8 28.1 57<br />
Upper Primary with Sec./H. Sec<br />
0 0.0 0.0 0.0<br />
0<br />
Position of teachers by educational qualification (Other than Contractual-teachers)<br />
School category<br />
Below<br />
Secondary Higher<br />
Secondary<br />
Secondary Graduate<br />
Primary only<br />
114 359 90 49<br />
Primary with Upper Primary<br />
9 52 61 74<br />
Primary with U. P. Sec/ Hr. Sec.<br />
0 1 12 51<br />
Upper Primary only<br />
55 108 66 152<br />
Upper Primary with Sec./Higher Secondary<br />
0 0 0 0<br />
Contractual-teachers<br />
Gender & caste distribution of teachers*<br />
School category Avg. No. of Tchs.<br />
Primary only<br />
6.3<br />
Primary with Upper Prim.<br />
8.6<br />
Prim.with U.P.Sec/Hr.Sec<br />
12.0<br />
Upper Primary only<br />
7.6<br />
U. Primary with Sec./Hr.S<br />
0.0<br />
Enrolment by medium of instructions*<br />
Pucca<br />
No. of schools by type of building*<br />
Post<br />
No<br />
Graduate M. Phil. Others response<br />
89.0<br />
51.0<br />
36.0<br />
100.0<br />
65.5<br />
54.8<br />
Enrolment<br />
All With disability<br />
Girls Boys Girls<br />
1,554 28 29<br />
1,189 33 30<br />
839 24 27<br />
763 24 41<br />
889 50 8<br />
823 17 27<br />
696 16 17<br />
0 0 0<br />
6,753 192 179<br />
Partially<br />
Multiple No<br />
Pucca Kuchcha Tent Type Building<br />
0 74 31 2 0 0<br />
2 16 6 0 0 0<br />
4 1 1 0 0 0<br />
2 34 18 1 0 0<br />
0 0 0 0 0 0<br />
3 0 1<br />
5 0 0 0<br />
8 0 0 0<br />
12 0 0 0<br />
0 0 0 0<br />
6 58 3 19 0 0 0 0<br />
Total<br />
Regular teachers Contractual-teachers SC teachers ST teachers<br />
Male Female No res Male Female No res Male Female Male Female<br />
673 381 235 0 35 22 0 10 5 405 251<br />
206 115 86 0 5 0 0 6 0 111 86<br />
72 38 34 0 0 0 0 4 0 23 26<br />
417 328 65 0 17 7 0 1 1 335 70<br />
0 0 0 0 0 0 0 0 0 0 0<br />
% Total Primary Upper Primary % Schools recvd.<br />
Grossness<br />
(Previous year)<br />
24.0<br />
16.4<br />
School T L M<br />
dev. grant grant<br />
Examination results<br />
(Previous academic year)<br />
Terminal % % Passed<br />
0 grade Passed with >60%<br />
V boys 95.1 6.6<br />
V girls 96.1 6.5<br />
V<strong>II</strong>I boys 93.4 10.7<br />
V<strong>II</strong>I girls 94.7 12.5<br />
%Teachers recvd.<br />
In-service training<br />
Male Female<br />
0.0 0.0<br />
0.8 0.0<br />
0.0 0.0<br />
0.0 0.0<br />
0.0 0.0<br />
Incentives : Number of beneficiaries<br />
(Previous academic year)<br />
Category English Mizo<br />
Incentive<br />
P. only<br />
4269<br />
0<br />
91.6 15.0 Type<br />
P + UP<br />
1771<br />
0<br />
58.3 20.8 Text books<br />
P+sec/hs<br />
1083<br />
0<br />
0.0 0.0 Uniform<br />
U.P. only<br />
1999<br />
69<br />
98.2 20.0 Attendance<br />
UP+Sec<br />
0<br />
0<br />
0.0 0.0 Stationery<br />
# = not applicable na = not available * Some totals may not match due to no response in classificatory data items<br />
Primary Upper primary<br />
Boys Girls Boys Girls<br />
4001 3791 1878 1795<br />
0 0 0 0<br />
0 0 51 50<br />
0 0 0 0<br />
393<br />
Mizoram


