

Volume II - DISE
Volume II - DISE
Volume II - DISE

You also want an ePaper? Increase the reach of your titles
YUMPU automatically turns print PDFs into web optimized ePapers that Google loves.
Punjab<br />
454<br />
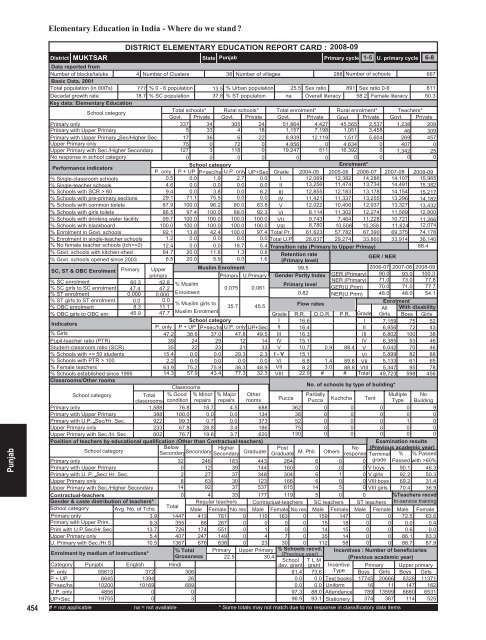
Elementary Education in India - Where do we stand <br />
District<br />
MUKTSAR<br />
DISTRICT ELEMENTARY EDUCATION REPORT CARD : 2008-09<br />
State Punjab<br />
Primary cycle<br />
1-5 U. primary cycle 6-8<br />
Data reported from<br />
Number of blocks/taluks<br />
4 Number of Clusters 38 Number of villages<br />
288 Number of schools<br />
667<br />
Basic Data, 2001<br />
Total population (in 000's) 777 % 0 - 6 population 13.5 % Urban population 25.5 Sex ratio 891 Sex ratio 0-6<br />
811<br />
Decadal growth rate<br />
18.7 % SC population 37.8 % ST population na Overall literacy 58.2 Female literacy 50.3<br />
Key data: Elementary Education<br />
School category<br />
Total schools* Rural schools* Total enrolment* Rural enrolment* Teachers*<br />
Govt. Private Govt. Private Govt. Private Govt. Private Govt. Private<br />
Primary only<br />
337 34 305 24 51,864 4,427 45,565 2,537 1,238 209<br />
Primary with Upper Primary<br />
5 33 4 18 1,157 7,198 1,051 3,458 46 309<br />
Primary with Upper Primary Sec/Higher Sec. 17 36 6 22 8,939 12,119 1,517 5,604 269 457<br />
Upper Primary only<br />
75 0 72 0 4,856 0 4,634 0 407 0<br />
Upper Primary with Sec./Higher Secondary 127 3 118 0 19,247 511 16,392 0 1,342 25<br />
No response in school category<br />
0 0 0 0 0 0 0 0 0 0<br />
Performance indicators<br />
School category<br />
Enrolment*<br />
P. only P + UP P+sec/hs U.P. only UP+Sec Grade 2004-05 2005-06 2006-07 2007-08 2008-09<br />
% Single-classroom schools<br />
0.5 0.0 1.9 2.7 0.0 I 12,069 12,382 14,286 14,107 15,965<br />
% Single-teacher schools<br />
4.6 0.0 0.0 0.0 0.0 <strong>II</strong> 13,256 11,474 13,734 14,491 15,382<br />
% Schools with SCR > 60<br />
9.4 0.0 3.8 0.0 6.2 <strong>II</strong>I 12,855 12,183 13,178 14,154 15,217<br />
% Schools with pre-primary sections 29.1 71.1 75.5 0.0 0.0 IV 11,421 11,337 13,255 13,296 14,182<br />
% Schools with common toilets 87.9 100.0 96.2 80.0 83.8 V 12,022 10,406 12,937 13,327 13,432<br />
% Schools with girls toilets 86.5 97.4 100.0 88.0 92.3 VI 8,114 11,302 12,274 11,569 12,800<br />
% Schools with drinking water facility 99.7 100.0 100.0 100.0 100.0 V<strong>II</strong> 9,743 7,464 11,228 10,721 11,266<br />
% Schools with blackboard<br />
100.0 100.0 100.0 100.0 100.0 V<strong>II</strong>I 8,780 10,508 10,358 11,624 12,074<br />
% Enrolment in Govt. schools 92.1 13.8 42.4 100.0 97.4 Total Pr. 61,623 57,782 67,390 69,375 74,178<br />
% Enrolment in single-teacher schools 1.2 0.0 0.0 0.0 0.0 Total U.P 26,637 29,274 33,860 33,914 36,140<br />
% No female teacher schools (tch>=2) 12.4 0.0 0.0 18.7 5.4 Transition rate (Primary to Upper Primay)<br />
88.4<br />
% Govt. schools with kitchen-shed 64.7 20.0 11.8 1.3 0.8 Retention rate<br />
% Govt. schools opened since 2003 6.5 20.0 5.9 0.0 1.6 (Primary level)<br />
/ NER<br />
GER<br />
SC, ST & OBC Enrolment Primary Upper<br />
Muslim Enrolment<br />
99.5<br />
2006-07 2007-08 2008-09<br />
primary<br />
Primary U.Primary Gender Parity Index GER (Primary) 90.0 93.0 100.3<br />
% SC enrolment<br />
% SC girls to SC enrolment<br />
% ST enrolment<br />
% ST girls to ST enrolment<br />
% OBC enrolment<br />
% OBC girls to OBC enr.<br />
Indicators<br />
% Girls<br />
Pupil-teacher ratio (PTR)<br />
Student-classroom ratio (SCR)<br />
% Schools with 100<br />
% Female teachers<br />
% Schools established since 1995<br />
Classrooms/Other rooms<br />
60.3 42.8<br />
NER (Primary)<br />
% Muslim<br />
Primary level<br />
47.4 47.2<br />
0.075 0.061<br />
GER(U.Prim)<br />
0.000 0.000<br />
Enrolment<br />
0.82 NER(U.Prim)<br />
0.0 0.0<br />
% Muslim girls to<br />
35.7 45.5<br />
Flow rates<br />
8.3 11.1<br />
45.9 47.7 Muslim Enrolment<br />
Grade R.R. D.O.R. P.R. Grade<br />
School category<br />
I 16.6<br />
I<br />
P. only P + UP P+sec/hs U.P. only UP+Sec <strong>II</strong> 16.4<br />
<strong>II</strong><br />
47.2 38.6 37.0 47.8 49.5 <strong>II</strong>I 16.3<br />
<strong>II</strong>I<br />
39 24 29 12 14 IV 15.1<br />
IV<br />
35 22 23 21 33 V 10.7 0.9 88.4 V<br />
15.4 0.0 0.0 29.3 2.3 I - V 15.1<br />
VI<br />
2.2 0.0 0.0 0.0 0.0 VI 8.8 1.4 89.8 V<strong>II</strong><br />
63.9 75.2 75.9 38.3 48.9 V<strong>II</strong> 8.2 3.0 88.8 V<strong>II</strong>I<br />
14.3 57.9 43.4 77.3 32.3 V<strong>II</strong>I 22.0 # # Total<br />
Classrooms<br />
School category<br />
Total<br />
classrooms<br />
% Good<br />
condition<br />
% Minor<br />
repairs<br />
% Major<br />
repairs<br />
Other<br />
rooms<br />
Primary only<br />
1,588 76.8 18.7 4.5 688<br />
Primary with Upper Primary<br />
388 100.0 0.0 0.0 134<br />
Primary with U.P. Sec/Hr. Sec.<br />
922 99.3 0.7 0.0 373<br />
Upper Primary only<br />
233 67.8 28.8 3.4 186<br />
Upper Primary with Sec./H. Sec<br />
602 76.7 19.6 3.7 620<br />
Position of teachers by educational qualification (Other than Contractual-teachers)<br />
School category<br />
Below<br />
Secondary Higher<br />
Secondary<br />
Secondary Graduate<br />
Primary only<br />
32 246 183 443<br />
Primary with Upper Primary<br />
0 12 39 144<br />
Primary with U. P. Sec/ Hr. Sec.<br />
2 27 37 348<br />
Upper Primary only<br />
8 63 30 123<br />
Upper Primary with Sec./Higher Secondary 14 92 37 537<br />
Contractual-teachers<br />
Gender & caste distribution of teachers*<br />
School category Avg. No. of Tchs.<br />
Primary only<br />
3.9<br />
Primary with Upper Prim.<br />
9.3<br />
Prim.with U.P.Sec/Hr.Sec<br />
13.7<br />
Upper Primary only<br />
5.4<br />
U. Primary with Sec./Hr.S<br />
10.5<br />
Enrolment by medium of instructions*<br />
71.0<br />
70.0<br />
48.0<br />
No. of schools by type of building*<br />
Post<br />
No<br />
Graduate M. Phil. Others response<br />
73.0<br />
71.0<br />
48.0<br />
77.8<br />
77.7<br />
54.1<br />
Enrolment<br />
All With disability<br />
Girls Boys Girls<br />
7,159 75 52<br />
6,956 72 43<br />
6,802 100 38<br />
6,385 53 46<br />
6,042 70 46<br />
5,899 82 88<br />
5,133 61 65<br />
5,347 85 78<br />
49,723 598 456<br />
Pucca<br />
Partially<br />
Multiple No<br />
Pucca Kuchcha Tent Type Building<br />
362 0 0 0 0 9<br />
38 0 0 0 0 0<br />
52 0 0 0 1 0<br />
75 0 0 0 0 0<br />
130 0 0 0 0 0<br />
264 6 0<br />
160 0 0 0<br />
304 6 1 0<br />
166 6 0 0<br />
615 14 5 0<br />
0 4 33 177 119 5 0 0<br />
Total<br />
Regular teachers Contractual-teachers SC teachers ST teachers<br />
Male Female No res Male Female No res Male Female Male Female<br />
1447 413 761 0 110 163 0 159 147 0 0<br />
355 88 267 0 0 0 0 15 18 0 0<br />
726 174 551 0 1 0 0 14 15 0 0<br />
407 247 149 0 4 7 0 35 14 0 0<br />
1367 676 638 0 23 30 0 112 58 0 0<br />
% Total Primary Upper Primary % Schools recvd.<br />
Grossness<br />
(Previous year)<br />
22.5<br />
30.4<br />
School T L M<br />
Hindi<br />
dev. grant grant<br />
Examination results<br />
(Previous academic year)<br />
Terminal % % Passed<br />
0 grade Passed with >60%<br />
V boys 90.1 46.3<br />
V girls 92.2 50.3<br />
V<strong>II</strong>I boys 69.2 31.4<br />
V<strong>II</strong>I girls 70.4 36.9<br />
%Teachers recvd.<br />
In-service training<br />
Male Female<br />
72.5 63.6<br />
0.0 0.4<br />
0.6 0.0<br />
86.1 83.3<br />
88.7 87.9<br />
Incentives : Number of beneficiaries<br />
(Previous academic year)<br />
Category Punjabi English<br />
Incentive<br />
P. only<br />
55613<br />
372<br />
306<br />
81.4 73.6 Type<br />
P + UP<br />
6645<br />
1394<br />
26<br />
0.0 0.0 Text books<br />
P+sec/hs 10200 10169<br />
689<br />
0.0 0.0 Uniform<br />
U.P. only<br />
4856<br />
0<br />
0<br />
97.3 88.0 Attendance<br />
UP+Sec<br />
19755<br />
0<br />
3<br />
96.9 93.1 Stationery<br />
# = not applicable na = not available * Some totals may not match due to no response in classificatory data items<br />
Primary Upper primary<br />
Boys Girls Boys Girls<br />
17745 20666 8328 11371<br />
16 11 147 162<br />
789 13599 6680 6531<br />
374 367 114 525


