

Volume II - DISE
Volume II - DISE
Volume II - DISE

Create successful ePaper yourself
Turn your PDF publications into a flip-book with our unique Google optimized e-Paper software.
District<br />
PITHORAGARH<br />
State Uttarakhand<br />
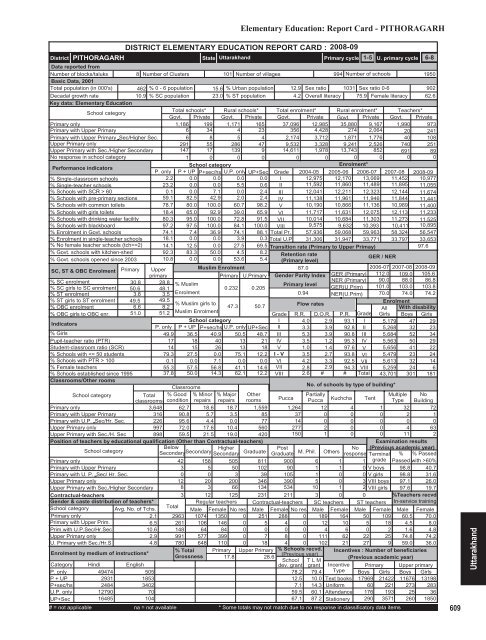
Elementary Education: Report Card - PITHORAGARH<br />
DISTRICT ELEMENTARY EDUCATION REPORT CARD : 2008-09<br />
Primary cycle<br />
1-5 U. primary cycle 6-8<br />
Data reported from<br />
Number of blocks/taluks<br />
8 Number of Clusters 101 Number of villages<br />
994 Number of schools<br />
1950<br />
Basic Data, 2001<br />
Total population (in 000's) 462 % 0 - 6 population 15.6 % Urban population 12.9 Sex ratio 1031 Sex ratio 0-6<br />
902<br />
Decadal growth rate<br />
10.9 % SC population 23.0 % ST population<br />
4.2 Overall literacy 75.9 Female literacy 62.6<br />
Key data: Elementary Education<br />
School category<br />
Total schools* Rural schools* Total enrolment* Rural enrolment* Teachers*<br />
Govt. Private Govt. Private Govt. Private Govt. Private Govt. Private<br />
Primary only<br />
1,186 199 1,171 165 37,096 12,985 35,880 9,167 1,990 973<br />
Primary with Upper Primary<br />
6 34 4 23 356 4,428 274 2,064 20 241<br />
Primary with Upper Primary Sec/Higher Sec.<br />
6 8 5 4 2,174 3,712 1,871 1,776 40 108<br />
Upper Primary only<br />
291 55 286 47 9,532 3,328 9,241 2,526 740 251<br />
Upper Primary with Sec./Higher Secondary 147 17 139 9 14,611 1,978 13,743 852 691 89<br />
No response in school category<br />
1 0 0 0 0 0 0 0 0 0<br />
Performance indicators<br />
School category<br />
Enrolment*<br />
P. only P + UP P+sec/hs U.P. only UP+Sec Grade 2004-05 2005-06 2006-07 2007-08 2008-09<br />
% Single-classroom schools<br />
2.2 0.0 0.0 0.0 0.0 I 12,975 12,170 13,069 11,452 10,977<br />
% Single-teacher schools<br />
23.2 0.0 0.0 5.5 0.6 <strong>II</strong> 11,592 11,860 11,489 11,895 11,055<br />
% Schools with SCR > 60<br />
0.1 0.0 7.1 0.0 2.4 <strong>II</strong>I 12,041 12,211 12,323 12,144 11,674<br />
% Schools with pre-primary sections 59.1 82.5 42.9 2.0 2.4 IV 11,138 11,961 11,946 11,844 11,441<br />
% Schools with common toilets 78.7 80.0 100.0 60.7 98.2 V 10,190 10,866 11,136 10,989 11,400<br />
% Schools with girls toilets 18.4 65.0 92.9 39.0 65.9 VI 11,717 11,631 12,075 12,113 11,233<br />
% Schools with drinking water facility 80.3 95.0 100.0 72.8 91.5 V<strong>II</strong> 10,014 10,684 11,303 11,273 11,525<br />
% Schools with blackboard<br />
97.2 97.5 100.0 84.1 100.0 V<strong>II</strong>I 9,575 9,632 10,393 10,411 10,895<br />
% Enrolment in Govt. schools 74.1 7.4 36.9 74.1 88.1 Total Pr. 57,936 59,068 59,963 58,324 56,547<br />
% Enrolment in single-teacher schools 18.1 0.0 0.0 3.9 0.3 Total U.P 31,306 31,947 33,771 33,797 33,653<br />
% No female teacher schools (tch>=2) 14.1 12.5 0.0 27.5 69.5 Transition rate (Primary to Upper Primay)<br />
97.6<br />
% Govt. schools with kitchen-shed 92.3 83.3 50.0 4.5 8.2 Retention rate<br />
% Govt. schools opened since 2003 10.8 0.0 0.0 53.6 5.4 (Primary level)<br />
/ NER<br />
GER<br />
SC, ST & OBC Enrolment Primary Upper<br />
Muslim Enrolment<br />
87.0<br />
2006-07 2007-08 2008-09<br />
primary<br />
Primary U.Primary Gender Parity Index GER (Primary) 112.0 109.0 105.6<br />
% SC enrolment<br />
% SC girls to SC enrolment<br />
% ST enrolment<br />
% ST girls to ST enrolment<br />
% OBC enrolment<br />
% OBC girls to OBC enr.<br />
Indicators<br />
% Girls<br />
Pupil-teacher ratio (PTR)<br />
Student-classroom ratio (SCR)<br />
% Schools with 100<br />
% Female teachers<br />
% Schools established since 1995<br />
Classrooms/Other rooms<br />
30.8 28.8 % Muslim<br />
Primary level<br />
50.6 48.1<br />
0.232 0.205<br />
3.8 3.5 Enrolment<br />
0.94<br />
49.5 49.5<br />
% Muslim girls to<br />
47.3 50.7<br />
Flow rates<br />
6.6 8.2<br />
51.0 51.2 Muslim Enrolment<br />
Grade<br />
School category<br />
I<br />
P. only P + UP P+sec/hs U.P. only UP+Sec <strong>II</strong><br />
49.9 36.5 40.9 50.5 48.7 <strong>II</strong>I<br />
17 18 40 13 21 IV<br />
14 15 26 13 18 V<br />
79.3 27.5 0.0 75.1 12.2 I - V<br />
0.1 0.0 7.1 0.0 0.0 VI<br />
55.3 57.5 56.8 41.1 14.6 V<strong>II</strong><br />
37.8 50.0 14.3 62.1 12.2 V<strong>II</strong>I<br />
Classrooms<br />
School category<br />
Total<br />
classrooms<br />
% Good<br />
condition<br />
% Minor<br />
repairs<br />
% Major<br />
repairs<br />
Other<br />
rooms<br />
Primary only<br />
3,648 62.7 18.6 18.7 1,559<br />
Primary with Upper Primary<br />
316 90.8 5.7 3.5 85<br />
Primary with U.P. Sec/Hr. Sec.<br />
226 95.6 4.4 0.0 77<br />
Upper Primary only<br />
997 72.0 17.6 10.4 560<br />
Upper Primary with Sec./H. Sec<br />
898 59.5 21.5 19.0 420<br />
Position of teachers by educational qualification (Other than Contractual-teachers)<br />
School category<br />
Below<br />
Secondary Higher<br />
Secondary<br />
Secondary Graduate<br />
Primary only<br />
42 158 505 811<br />
Primary with Upper Primary<br />
3 5 50 102<br />
Primary with U. P. Sec/ Hr. Sec.<br />
0 0 3 39<br />
Upper Primary only<br />
12 20 200 346<br />
Upper Primary with Sec./Higher Secondary<br />
8 3 66 134<br />
Contractual-teachers<br />
Gender & caste distribution of teachers*<br />
School category Avg. No. of Tchs.<br />
Primary only<br />
2.1<br />
Primary with Upper Prim.<br />
6.5<br />
Prim.with U.P.Sec/Hr.Sec<br />
10.6<br />
Upper Primary only<br />
2.9<br />
U. Primary with Sec./Hr.S<br />
4.8<br />
Enrolment by medium of instructions*<br />
NER (Primary)<br />
GER(U.Prim)<br />
NER(U.Prim)<br />
R.R. D.O.R. P.R. Grade<br />
4.0 2.9 93.1 I<br />
3.3 3.9 92.8 <strong>II</strong><br />
5.3 3.9 90.8 <strong>II</strong>I<br />
3.5 1.2 95.3 IV<br />
1.0 1.4 97.6 V<br />
3.5 2.7 93.8 VI<br />
4.2 3.3 92.5 V<strong>II</strong><br />
2.8 2.9 94.3 V<strong>II</strong>I<br />
2.6 # # Total<br />
90.0<br />
101.0<br />
70.0<br />
No. of schools by type of building*<br />
Post<br />
No<br />
Graduate M. Phil. Others response<br />
88.0<br />
103.0<br />
74.0<br />
86.8<br />
103.8<br />
74.2<br />
Enrolment<br />
All With disability<br />
Girls Boys Girls<br />
5,179 47 29<br />
5,268 32 23<br />
5,684 52 34<br />
5,563 50 29<br />
5,656 41 22<br />
5,479 23 24<br />
5,613 32 14<br />
5,259 24 6<br />
43,701 301 181<br />
Pucca<br />
Partially<br />
Multiple No<br />
Pucca Kuchcha Tent Type Building<br />
1,264 12 4 1 32 72<br />
37 0 0 0 2 1<br />
14 0 0 0 0 0<br />
277 2 0 0 4 63<br />
150 1 0 0 11 2<br />
900 6 1<br />
90 1 1 0<br />
105 1 0 0<br />
390 5 0 3<br />
534 10 1 2<br />
3 12 125 231 211 3 0 0<br />
Total<br />
Regular teachers Contractual-teachers SC teachers ST teachers<br />
Male Female No res Male Female No res Male Female Male Female<br />
2963 1074 1350 0 251 288 0 189 164 50 109<br />
261 106 146 0 5 4 0 12 10 5 18<br />
148 64 84 0 0 0 0 4 6 0 2<br />
991 577 399 0 7 8 0 111 62 22 25<br />
780 648 110 0 18 4 0 102 21 27 9<br />
% Total Primary Upper Primary % Schools recvd.<br />
Grossness<br />
(Previous year)<br />
17.8<br />
28.6<br />
School T L M<br />
dev. grant grant<br />
Examination results<br />
(Previous academic year)<br />
Terminal % % Passed<br />
1 grade Passed with >60%<br />
V boys 98.8 40.7<br />
V girls 98.8 31.6<br />
V<strong>II</strong>I boys 97.1 26.0<br />
V<strong>II</strong>I girls 97.6 19.7<br />
%Teachers recvd.<br />
In-service training<br />
Male Female<br />
60.5 70.0<br />
4.5 8.0<br />
1.6 4.8<br />
74.8 74.2<br />
59.0 36.0<br />
Incentives : Number of beneficiaries<br />
(Previous academic year)<br />
Category Hindi English<br />
Incentive<br />
P. only<br />
49474<br />
505<br />
78.2 79.4 Type<br />
P + UP<br />
2931<br />
1853<br />
12.5 10.0 Text books<br />
P+sec/hs<br />
2484<br />
3402<br />
7.1 14.3 Uniform<br />
U.P. only 12790<br />
70<br />
59.5 60.1 Attendance<br />
UP+Sec<br />
16485<br />
104<br />
67.1 87.2 Stationery<br />
# = not applicable na = not available * Some totals may not match due to no response in classificatory data items<br />
Primary Upper primary<br />
Boys Girls Boys Girls<br />
17969 21422 11676 13198<br />
60 221 273 283<br />
176 193 25 36<br />
290 3571 260 1850<br />
609<br />
Uttarakhand


