

Volume II - DISE
Volume II - DISE
Volume II - DISE

Create successful ePaper yourself
Turn your PDF publications into a flip-book with our unique Google optimized e-Paper software.
Uttar Pradesh<br />
588<br />
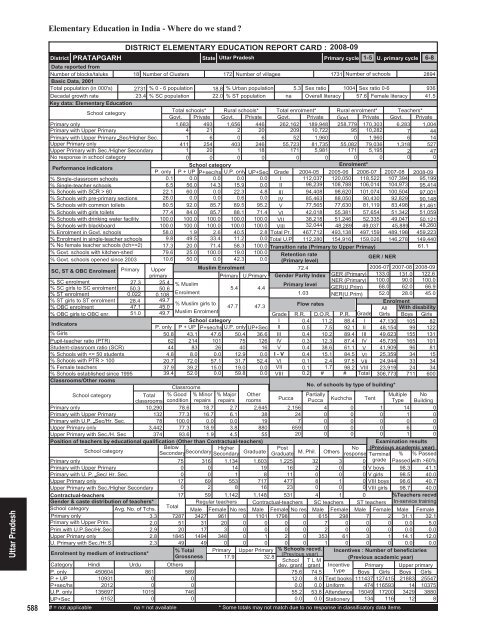
Elementary Education in India - Where do we stand <br />
District<br />
PRATAPGARH<br />
DISTRICT ELEMENTARY EDUCATION REPORT CARD : 2008-09<br />
State Uttar Pradesh<br />
Primary cycle<br />
1-5 U. primary cycle 6-8<br />
Data reported from<br />
Number of blocks/taluks 18 Number of Clusters 172 Number of villages<br />
1731 Number of schools<br />
2894<br />
Basic Data, 2001<br />
Total population (in 000's) 2731 % 0 - 6 population 18.8 % Urban population 5.3 Sex ratio 1004 Sex ratio 0-6<br />
936<br />
Decadal growth rate<br />
23.4 % SC population 22.0 % ST population na Overall literacy 57.6 Female literacy 41.5<br />
Key data: Elementary Education<br />
School category<br />
Total schools* Rural schools* Total enrolment* Rural enrolment* Teachers*<br />
Govt. Private Govt. Private Govt. Private Govt. Private Govt. Private<br />
Primary only<br />
1,683 493 1,656 446 262,162 189,948 258,779 170,303 6,283 1,004<br />
Primary with Upper Primary<br />
4 21 2 20 209 10,722 95 10,282 7 44<br />
Primary with Upper Primary Sec/Higher Sec.<br />
1 6 0 6 52 1,960 0 1,960 6 14<br />
Upper Primary only<br />
411 254 403 246 55,723 81,735 55,082 79,036 1,318 527<br />
Upper Primary with Sec./Higher Secondary<br />
1 20 1 18 171 5,981 171 5,195 2 47<br />
No response in school category<br />
0 0 0 0 0 0 0 0 0 0<br />
Performance indicators<br />
School category<br />
Enrolment*<br />
P. only P + UP P+sec/hs U.P. only UP+Sec Grade 2004-05 2005-06 2006-07 2007-08 2008-09<br />
% Single-classroom schools<br />
0.1 0.0 0.0 0.0 0.0 I 112,037 120,050 118,522 107,394 95,199<br />
% Single-teacher schools<br />
6.5 56.0 14.3 15.9 0.0 <strong>II</strong> 98,239 108,788 106,014 104,973 95,414<br />
% Schools with SCR > 60<br />
22.1 60.0 0.0 22.3 4.8 <strong>II</strong>I 94,408 98,620 101,074 100,504 97,001<br />
% Schools with pre-primary sections 26.0 0.0 0.0 0.6 0.0 IV 85,463 88,050 90,430 92,829 90,148<br />
% Schools with common toilets 80.5 92.0 85.7 89.5 95.2 V 77,565 77,630 81,119 83,498 81,461<br />
% Schools with girls toilets 77.4 84.0 85.7 88.1 71.4 VI 42,018 55,381 57,654 51,342 51,059<br />
% Schools with drinking water facility 100.0 100.0 100.0 100.0 100.0 V<strong>II</strong> 38,218 51,246 52,335 49,047 50,121<br />
% Schools with blackboard<br />
100.0 100.0 100.0 100.0 100.0 V<strong>II</strong>I 32,044 48,289 49,037 45,889 48,260<br />
% Enrolment in Govt. schools 58.0 1.9 2.6 40.5 2.8 Total Pr. 467,712 493,138 497,159 489,198 459,223<br />
% Enrolment in single-teacher schools 9.8 49.5 33.4 11.2 0.0 Total U.P 112,280 154,916 159,026 146,278 149,440<br />
% No female teacher schools (tch>=2) 17.3 20.0 71.4 58.3 100.0 Transition rate (Primary to Upper Primay)<br />
61.1<br />
% Govt. schools with kitchen-shed 79.6 25.0 100.0 19.0 100.0 Retention rate<br />
% Govt. schools opened since 2003 10.6 50.0 0.0 42.3 0.0 (Primary level)<br />
/ NER<br />
GER<br />
SC, ST & OBC Enrolment Primary Upper<br />
Muslim Enrolment<br />
72.4<br />
2006-07 2007-08 2008-09<br />
primary<br />
Primary U.Primary Gender Parity Index GER (Primary) 133.0 131.0 122.6<br />
% SC enrolment<br />
% SC girls to SC enrolment<br />
% ST enrolment<br />
% ST girls to ST enrolment<br />
% OBC enrolment<br />
% OBC girls to OBC enr.<br />
Indicators<br />
% Girls<br />
Pupil-teacher ratio (PTR)<br />
Student-classroom ratio (SCR)<br />
% Schools with 100<br />
% Female teachers<br />
% Schools established since 1995<br />
Classrooms/Other rooms<br />
27.3 25.4 % Muslim<br />
Primary level<br />
50.3 50.6<br />
5.4 4.4<br />
0.022 0.108<br />
Enrolment<br />
1.03<br />
28.4 49.7<br />
% Muslim girls to<br />
47.7 47.3<br />
Flow rates<br />
47.1 45.0<br />
51.0 49.7 Muslim Enrolment<br />
Grade<br />
School category<br />
I<br />
P. only P + UP P+sec/hs U.P. only UP+Sec <strong>II</strong><br />
50.8 43.1 47.6 50.4 36.6 <strong>II</strong>I<br />
62 214 101 75 126 IV<br />
44 83 26 40 16 V 0.4<br />
4.8 8.0 0.0 12.9 0.0 I - V 0.4<br />
20.7 72.0 57.1 31.7 52.4 VI 0.1<br />
37.9 39.2 15.0 19.0 0.0 V<strong>II</strong> 0.1<br />
39.4 52.0 0.0 59.8 0.0 V<strong>II</strong>I 0.2<br />
Classrooms<br />
School category<br />
Total<br />
classrooms<br />
% Good<br />
condition<br />
% Minor<br />
repairs<br />
% Major<br />
repairs<br />
Other<br />
rooms<br />
Primary only<br />
10,290 78.6 18.7 2.7 2,645<br />
Primary with Upper Primary<br />
132 77.3 16.7 6.1 38<br />
Primary with U.P. Sec/Hr. Sec.<br />
78 100.0 0.0 0.0 19<br />
Upper Primary only<br />
3,442 77.3 18.9 3.8 880<br />
Upper Primary with Sec./H. Sec<br />
374 93.6 1.9 4.5 55<br />
Position of teachers by educational qualification (Other than Contractual-teachers)<br />
School category<br />
Below<br />
Secondary Higher<br />
Secondary<br />
Secondary Graduate<br />
Primary only<br />
75 316 1,134 1,603<br />
Primary with Upper Primary<br />
0 0 14 19<br />
Primary with U. P. Sec/ Hr. Sec.<br />
0 0 1 8<br />
Upper Primary only<br />
17 69 553 717<br />
Upper Primary with Sec./Higher Secondary<br />
0 2 8 16<br />
Contractual-teachers<br />
Gender & caste distribution of teachers*<br />
School category Avg. No. of Tchs.<br />
Primary only<br />
3.3<br />
Primary with Upper Prim.<br />
2.0<br />
Prim.with U.P.Sec/Hr.Sec<br />
2.9<br />
Upper Primary only<br />
2.8<br />
U. Primary with Sec./Hr.S<br />
2.3<br />
Enrolment by medium of instructions*<br />
NER (Primary)<br />
GER(U.Prim)<br />
NER(U.Prim)<br />
Grade<br />
11.2 88.4 I<br />
7.5 92.1 <strong>II</strong><br />
10.2 89.4 <strong>II</strong>I<br />
12.3 87.4 IV<br />
38.6 61.1 V<br />
15.1 84.5 VI<br />
2.4 97.5 V<strong>II</strong><br />
1.7 98.2 V<strong>II</strong>I<br />
# # Total<br />
R.R. D.O.R. P.R.<br />
0.4<br />
0.5<br />
0.4<br />
0.3<br />
100.0<br />
68.0<br />
52.0<br />
No. of schools by type of building*<br />
Post<br />
No<br />
Graduate M. Phil. Others response<br />
90.0<br />
62.0<br />
28.0<br />
100.0<br />
66.9<br />
45.0<br />
Enrolment<br />
All With disability<br />
Girls Boys Girls<br />
47,130 105 82<br />
48,154 99 122<br />
49,623 155 131<br />
45,735 165 101<br />
41,909 96 81<br />
25,359 34 15<br />
24,944 33 34<br />
23,919 24 34<br />
306,773 711 600<br />
Pucca<br />
Partially<br />
Multiple No<br />
Pucca Kuchcha Tent Type Building<br />
2,156 4 0 1 14 0<br />
24 0 0 0 1 0<br />
7 0 0 0 0 0<br />
659 0 0 0 6 0<br />
20 0 0 0 1 0<br />
1,225 32 3<br />
16 2 0 0<br />
11 0 0 0<br />
477 8 1 0<br />
23 0 0 0<br />
17 59 1,142 1,148 531 4 1 0<br />
Total<br />
Regular teachers Contractual-teachers SC teachers ST teachers<br />
Male Female No res Male Female No res Male Female Male Female<br />
7287 3427 961 0 1101 1798 0 615 298 7 2<br />
51 31 20 0 0 0 0 7 0 0 0<br />
20 17 3 0 0 0 0 2 0 0 0<br />
1845 1494 348 0 1 2 0 353 61 3 1<br />
49 49 0 0 0 0 0 1 0 0 0<br />
% Total Primary Upper Primary % Schools recvd.<br />
Grossness<br />
(Previous year)<br />
17.9<br />
32.8<br />
School T L M<br />
dev. grant grant<br />
Examination results<br />
(Previous academic year)<br />
Terminal % % Passed<br />
0 grade Passed with >60%<br />
V boys 98.3 41.1<br />
V girls 98.5 40.0<br />
V<strong>II</strong>I boys 98.6 40.7<br />
V<strong>II</strong>I girls 98.7 40.0<br />
%Teachers recvd.<br />
In-service training<br />
Male Female<br />
31.1 32.1<br />
0.0 5.0<br />
0.0 0.0<br />
14.1 12.0<br />
0.0 0.0<br />
Incentives : Number of beneficiaries<br />
(Previous academic year)<br />
Category Hindi<br />
Urdu Others<br />
Incentive<br />
P. only<br />
450604<br />
861<br />
589<br />
75.6 74.5 Type<br />
P + UP<br />
10931<br />
0<br />
0<br />
12.0 8.0 Text books<br />
P+sec/hs<br />
2012<br />
0<br />
0<br />
0.0 0.0 Uniform<br />
U.P. only 135697<br />
1015<br />
746<br />
55.2 53.8 Attendance<br />
UP+Sec<br />
6152<br />
0<br />
0<br />
0.0 0.0 Stationery<br />
# = not applicable na = not available * Some totals may not match due to no response in classificatory data items<br />
Primary Upper primary<br />
Boys Girls Boys Girls<br />
111437 127415 21883 25547<br />
474 116593 14 10375<br />
15049 17200 3429 3880<br />
134 116 12 8


