

Volume II - DISE
Volume II - DISE
Volume II - DISE

You also want an ePaper? Increase the reach of your titles
YUMPU automatically turns print PDFs into web optimized ePapers that Google loves.
District<br />
MAHE<br />
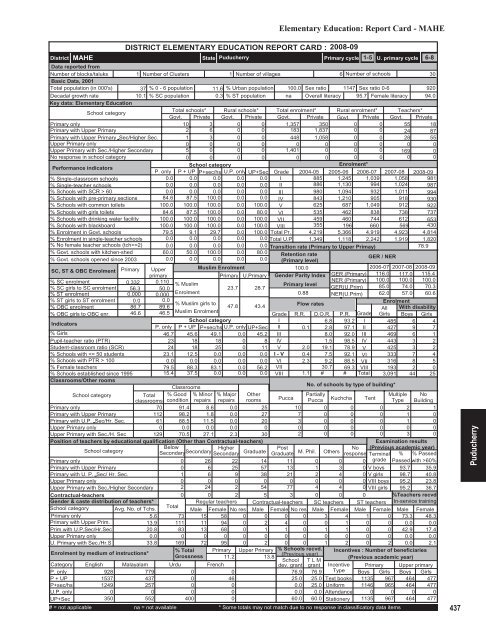
DISTRICT ELEMENTARY EDUCATION REPORT CARD : 2008-09<br />
State Puducherry<br />
Elementary Education: Report Card - MAHE<br />
Primary cycle<br />
1-5 U. primary cycle 6-8<br />
Data reported from<br />
Number of blocks/taluks<br />
1 Number of Clusters 1 Number of villages<br />
6 Number of schools<br />
30<br />
Basic Data, 2001<br />
Total population (in 000's)<br />
37 % 0 - 6 population 11.6 % Urban population 100.0 Sex ratio 1147 Sex ratio 0-6<br />
920<br />
Decadal growth rate<br />
10.1 % SC population 0.3 % ST population na Overall literacy 95.7 Female literacy 94.0<br />
Key data: Elementary Education<br />
School category<br />
Total schools* Rural schools* Total enrolment* Rural enrolment* Teachers*<br />
Govt. Private Govt. Private Govt. Private Govt. Private Govt. Private<br />
Primary only<br />
10 3 0 0 1,357 350 0 0 55 18<br />
Primary with Upper Primary<br />
2 6 0 0 183 1,837 0 0 24 87<br />
Primary with Upper Primary Sec/Higher Sec.<br />
1 3 0 0 448 1,058 0 0 28 55<br />
Upper Primary only<br />
0 0 0 0 0 0 0 0 0 0<br />
Upper Primary with Sec./Higher Secondary<br />
5 0 0 0 1,401 0 0 0 169 0<br />
No response in school category<br />
0 0 0 0 0 0 0 0 0 0<br />
Performance indicators<br />
School category<br />
Enrolment*<br />
P. only P + UP P+sec/hs U.P. only UP+Sec Grade 2004-05 2005-06 2006-07 2007-08 2008-09<br />
% Single-classroom schools<br />
0.0 0.0 0.0 0.0 0.0 I<br />
885 1,245 1,039 1,058 981<br />
% Single-teacher schools<br />
0.0 0.0 0.0 0.0 0.0 <strong>II</strong><br />
886 1,130 994 1,024 987<br />
% Schools with SCR > 60<br />
0.0 0.0 0.0 0.0 0.0 <strong>II</strong>I<br />
980 1,094 932 1,011 994<br />
% Schools with pre-primary sections 84.6 87.5 100.0 0.0 0.0 IV<br />
843 1,210 905 918 930<br />
% Schools with common toilets 100.0 100.0 100.0 0.0 100.0 V<br />
625 687 1,049 912 922<br />
% Schools with girls toilets 84.6 87.5 100.0 0.0 80.0 VI<br />
535 462 838 738 737<br />
% Schools with drinking water facility 100.0 100.0 100.0 0.0 100.0 V<strong>II</strong><br />
459 460 744 612 653<br />
% Schools with blackboard<br />
100.0 100.0 100.0 0.0 100.0 V<strong>II</strong>I<br />
355 196 660 569 430<br />
% Enrolment in Govt. schools 79.5 9.1 29.7 0.0 100.0 Total Pr. 4,219 5,366 4,919 4,923 4,814<br />
% Enrolment in single-teacher schools 0.0 0.0 0.0 0.0 0.0 Total U.P 1,349 1,118 2,242 1,919 1,820<br />
% No female teacher schools (tch>=2) 0.0 0.0 0.0 0.0 0.0 Transition rate (Primary to Upper Primay)<br />
78.9<br />
% Govt. schools with kitchen-shed 60.0 50.0 100.0 0.0 80.0 Retention rate<br />
% Govt. schools opened since 2003 0.0 0.0 0.0 0.0 0.0 (Primary level)<br />
/ NER<br />
GER<br />
SC, ST & OBC Enrolment Primary Upper<br />
Muslim Enrolment<br />
100.0<br />
2006-07 2007-08 2008-09<br />
primary<br />
Primary U.Primary Gender Parity Index GER (Primary) 116.0 117.0 115.4<br />
% SC enrolment<br />
% SC girls to SC enrolment<br />
% ST enrolment<br />
% ST girls to ST enrolment<br />
% OBC enrolment<br />
% OBC girls to OBC enr.<br />
Indicators<br />
% Girls<br />
Pupil-teacher ratio (PTR)<br />
Student-classroom ratio (SCR)<br />
% Schools with 100<br />
% Female teachers<br />
% Schools established since 1995<br />
Classrooms/Other rooms<br />
0.332 0.110<br />
NER (Primary) 100.0<br />
% Muslim<br />
Primary level<br />
56.3 50.0<br />
23.7 28.7<br />
GER(U.Prim) 85.0<br />
0.000 0.000<br />
Enrolment<br />
0.88 NER(U.Prim) 62.0<br />
0.0 0.0<br />
% Muslim girls to<br />
47.8 43.4<br />
Flow rates<br />
86.7 89.6<br />
46.6 46.5 Muslim Enrolment<br />
Grade R.R. D.O.R. P.R. Grade<br />
School category<br />
I<br />
6.8 93.2 I<br />
P. only P + UP P+sec/hs U.P. only UP+Sec <strong>II</strong> 0.1 2.8 97.1 <strong>II</strong><br />
46.7 45.6 49.1 0.0 45.2 <strong>II</strong>I<br />
8.0 92.0 <strong>II</strong>I<br />
23 18 18 0 8 IV<br />
1.5 98.5 IV<br />
24 18 25 0 11 V 2.0 19.1 78.9 V<br />
23.1 12.5 0.0 0.0 0.0 I - V 0.4 7.5 92.1 VI<br />
0.0 0.0 0.0 0.0 0.0 VI 2.3 9.2 88.5 V<strong>II</strong><br />
79.5 88.3 83.1 0.0 56.2 V<strong>II</strong><br />
30.7 69.3 V<strong>II</strong>I<br />
15.4 37.5 0.0 0.0 0.0 V<strong>II</strong>I 1.1 # # Total<br />
Classrooms<br />
School category<br />
Total<br />
classrooms<br />
% Good<br />
condition<br />
% Minor<br />
repairs<br />
% Major<br />
repairs<br />
Other<br />
rooms<br />
Primary only<br />
70 91.4 8.6 0.0 25<br />
Primary with Upper Primary<br />
112 98.2 1.8 0.0 27<br />
Primary with U.P. Sec/Hr. Sec.<br />
61 88.5 11.5 0.0 20<br />
Upper Primary only<br />
0 0.0 0.0 0.0<br />
0<br />
Upper Primary with Sec./H. Sec<br />
129 70.5 27.1 2.3 30<br />
Position of teachers by educational qualification (Other than Contractual-teachers)<br />
School category<br />
Below<br />
Secondary Higher<br />
Secondary<br />
Secondary Graduate<br />
Primary only<br />
0 26 22 14<br />
Primary with Upper Primary<br />
0 6 25 57<br />
Primary with U. P. Sec/ Hr. Sec.<br />
1 6 9 38<br />
Upper Primary only<br />
0 0 0 0<br />
Upper Primary with Sec./Higher Secondary<br />
2 24 2 54<br />
Contractual-teachers<br />
Gender & caste distribution of teachers*<br />
School category Avg. No. of Tchs.<br />
Primary only<br />
5.6<br />
Primary with Upper Prim.<br />
13.9<br />
Prim.with U.P.Sec/Hr.Sec<br />
20.8<br />
Upper Primary only<br />
0.0<br />
U. Primary with Sec./Hr.S<br />
33.8<br />
Enrolment by medium of instructions*<br />
Pucca<br />
No. of schools by type of building*<br />
Post<br />
No<br />
Graduate M. Phil. Others response<br />
100.0<br />
74.0<br />
57.0<br />
100.0<br />
70.3<br />
60.6<br />
Enrolment<br />
All With disability<br />
Girls Boys Girls<br />
485 6 4<br />
427 9 7<br />
469 6 1<br />
443 3 2<br />
425 3 2<br />
333 7 4<br />
316 8 5<br />
193 2 0<br />
3,091 44 25<br />
Partially<br />
Multiple No<br />
Pucca Kuchcha Tent Type Building<br />
10 0 0 0 2 1<br />
7 0 0 0 1 0<br />
3 0 0 0 1 0<br />
0 0 0 0 0 0<br />
2 0 0 0 3 0<br />
11 0 0<br />
13 1 3 0<br />
21 2 4 0<br />
0 0 0 0<br />
77 4 4 0<br />
0 0 2 5 3 0 0 0<br />
Total<br />
Regular teachers Contractual-teachers SC teachers ST teachers<br />
Male Female No res Male Female No res Male Female Male Female<br />
73 15 58 0 0 0 0 3 4 1 0<br />
111 11 94 0 2 4 0 0 1 0 0<br />
83 13 68 0 1 1 0 1 1 0 0<br />
0 0 0 0 0 0 0 0 0 0 0<br />
169 72 95 0 2 0 0 1 2 0 2<br />
% Total Primary Upper Primary % Schools recvd.<br />
Grossness<br />
(Previous year)<br />
11.2<br />
13.8<br />
School T L M<br />
Urdu French<br />
dev. grant grant<br />
Examination results<br />
(Previous academic year)<br />
Terminal % % Passed<br />
0 grade Passed with >60%<br />
V boys 93.7 35.9<br />
V girls 98.7 40.8<br />
V<strong>II</strong>I boys 95.2 23.8<br />
V<strong>II</strong>I girls 95.2 36.7<br />
%Teachers recvd.<br />
In-service training<br />
Male Female<br />
73.3 48.3<br />
0.0 0.0<br />
42.9 17.4<br />
0.0 0.0<br />
0.0 2.1<br />
Incentives : Number of beneficiaries<br />
(Previous academic year)<br />
Category English Malayalam<br />
Incentive<br />
P. only<br />
928<br />
779<br />
0<br />
0<br />
76.9 76.9 Type<br />
P + UP<br />
1537<br />
437<br />
0<br />
46<br />
25.0 25.0 Text books<br />
P+sec/hs<br />
1249<br />
257<br />
0<br />
0<br />
0.0 25.0 Uniform<br />
U.P. only<br />
0<br />
0<br />
0<br />
0<br />
0.0 0.0 Attendance<br />
UP+Sec<br />
350<br />
552<br />
400<br />
0<br />
60.0 60.0 Stationery<br />
# = not applicable na = not available * Some totals may not match due to no response in classificatory data items<br />
Primary Upper primary<br />
Boys Girls Boys Girls<br />
1135 967 464 477<br />
1146 965 464 477<br />
0 0 0 0<br />
1135 967 464 477<br />
437<br />
Puducherry


