

Volume II - DISE
Volume II - DISE
Volume II - DISE

Create successful ePaper yourself
Turn your PDF publications into a flip-book with our unique Google optimized e-Paper software.
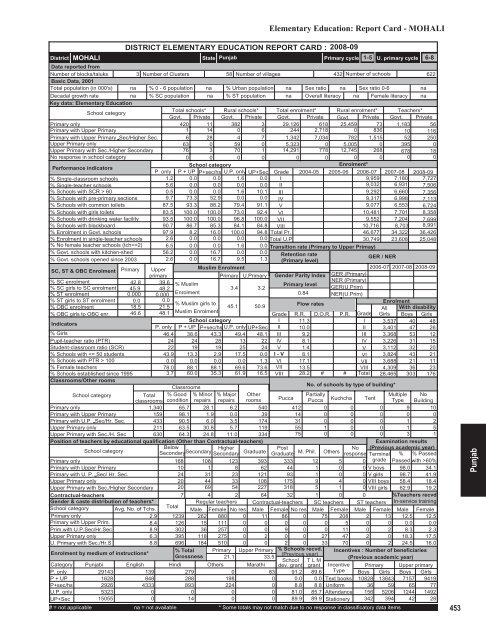
District<br />
MOHALI<br />
State Punjab<br />
Elementary Education: Report Card - MOHALI<br />
DISTRICT ELEMENTARY EDUCATION REPORT CARD : 2008-09<br />
Primary cycle<br />
1-5 U. primary cycle 6-8<br />
Data reported from<br />
Number of blocks/taluks<br />
3 Number of Clusters 58 Number of villages<br />
432 Number of schools<br />
622<br />
Basic Data, 2001<br />
Total population (in 000's) na % 0 - 6 population na % Urban population na Sex ratio na Sex ratio 0-6<br />
na<br />
Decadal growth rate<br />
na % SC population na % ST population na Overall literacy na Female literacy na<br />
Key data: Elementary Education<br />
School category<br />
Total schools* Rural schools* Total enrolment* Rural enrolment* Teachers*<br />
Govt. Private Govt. Private Govt. Private Govt. Private Govt. Private<br />
Primary only<br />
420 11 382 3 29,126 618 25,459 73 1,183 56<br />
Primary with Upper Primary<br />
1 14 0 6 244 2,718 0 836 10 116<br />
Primary with Upper Primary Sec/Higher Sec.<br />
6 28 4 7 1,342 7,034 782 1,515 52 250<br />
Upper Primary only<br />
63 0 59 0 5,323 0 5,005 0 395 0<br />
Upper Primary with Sec./Higher Secondary<br />
76 3 70 1 14,291 778 12,745 268 678 18<br />
No response in school category<br />
0 0 0 0 0 0 0 0 0 0<br />
Performance indicators<br />
School category<br />
Enrolment*<br />
P. only P + UP P+sec/hs U.P. only UP+Sec Grade 2004-05 2005-06 2006-07 2007-08 2008-09<br />
% Single-classroom schools<br />
1.2 0.0 0.0 1.6 0.0 I<br />
9,959 7,180 7,727<br />
% Single-teacher schools<br />
5.6 0.0 0.0 0.0 0.0 <strong>II</strong><br />
9,032 6,931 7,506<br />
% Schools with SCR > 60<br />
0.5 0.0 0.0 1.6 10.1 <strong>II</strong>I<br />
9,292 6,660 7,356<br />
% Schools with pre-primary sections 9.7 73.3 52.9 0.0 0.0 IV<br />
9,317 6,998 7,113<br />
% Schools with common toilets 87.5 93.3 88.2 79.4 91.1 V<br />
9,077 6,553 6,724<br />
% Schools with girls toilets 83.5 100.0 100.0 73.0 92.4 VI<br />
10,481 7,701 8,358<br />
% Schools with drinking water facility 93.5 100.0 100.0 96.8 100.0 V<strong>II</strong><br />
9,552 7,204 7,699<br />
% Schools with blackboard<br />
90.7 86.7 85.3 84.1 84.8 V<strong>II</strong>I<br />
10,716 8,703 8,991<br />
% Enrolment in Govt. schools 97.9 8.2 16.0 100.0 94.8 Total Pr. 46,677 34,322 36,426<br />
% Enrolment in single-teacher schools 2.6 0.0 0.0 0.0 0.0 Total U.P<br />
30,749 23,608 25,048<br />
% No female teacher schools (tch>=2) 6.5 0.0 0.0 1.6 0.0 Transition rate (Primary to Upper Primay)<br />
% Govt. schools with kitchen-shed 56.2 0.0 16.7 0.0 0.0 Retention rate<br />
% Govt. schools opened since 2003 2.6 0.0 16.7 9.5 1.3 (Primary level)<br />
/ NER<br />
GER<br />
SC, ST & OBC Enrolment Primary Upper<br />
Muslim Enrolment<br />
2006-07 2007-08 2008-09<br />
primary<br />
Primary U.Primary Gender Parity Index GER (Primary)<br />
% SC enrolment<br />
% SC girls to SC enrolment<br />
% ST enrolment<br />
% ST girls to ST enrolment<br />
% OBC enrolment<br />
% OBC girls to OBC enr.<br />
Indicators<br />
% Girls<br />
Pupil-teacher ratio (PTR)<br />
Student-classroom ratio (SCR)<br />
% Schools with 100<br />
% Female teachers<br />
% Schools established since 1995<br />
Classrooms/Other rooms<br />
42.8 39.6<br />
NER (Primary)<br />
% Muslim<br />
Primary level<br />
45.9 48.2<br />
3.4 3.2<br />
GER(U.Prim)<br />
0.000 0.000<br />
Enrolment<br />
0.84 NER(U.Prim)<br />
0.0 0.0<br />
% Muslim girls to<br />
45.1 50.9<br />
Flow rates<br />
18.5 21.5<br />
46.6 48.1 Muslim Enrolment<br />
Grade R.R. D.O.R. P.R. Grade<br />
School category<br />
I 11.3<br />
I<br />
P. only P + UP P+sec/hs U.P. only UP+Sec <strong>II</strong> 10.0<br />
<strong>II</strong><br />
46.4 38.6 43.3 49.4 48.1 <strong>II</strong>I 9.2<br />
<strong>II</strong>I<br />
24 24 28 13 22 IV 8.1<br />
IV<br />
22 19 19 25 24 V 1.4<br />
V<br />
43.9 13.3 2.9 17.5 0.0 I - V 8.1<br />
VI<br />
0.0 0.0 0.0 0.0 1.3 VI 17.1<br />
V<strong>II</strong><br />
78.0 88.1 88.1 69.6 73.6 V<strong>II</strong> 13.5<br />
V<strong>II</strong>I<br />
3.7 60.0 35.3 61.9 16.5 V<strong>II</strong>I 28.2 # # Total<br />
Classrooms<br />
School category<br />
Total<br />
classrooms<br />
% Good<br />
condition<br />
% Minor<br />
repairs<br />
% Major<br />
repairs<br />
Other<br />
rooms<br />
Primary only<br />
1,340 65.7 28.1 6.2 540<br />
Primary with Upper Primary<br />
159 98.1 1.9 0.0 39<br />
Primary with U.P. Sec/Hr. Sec.<br />
433 90.5 6.0 3.5 174<br />
Upper Primary only<br />
211 63.5 30.8 5.7 119<br />
Upper Primary with Sec./H. Sec<br />
630 64.3 24.8 11.0 334<br />
Position of teachers by educational qualification (Other than Contractual-teachers)<br />
School category<br />
Below<br />
Secondary Higher<br />
Secondary<br />
Secondary Graduate<br />
Primary only<br />
168 108 123 393<br />
Primary with Upper Primary<br />
10 1 8 62<br />
Primary with U. P. Sec/ Hr. Sec.<br />
24 31 23 121<br />
Upper Primary only<br />
20 44 33 108<br />
Upper Primary with Sec./Higher Secondary 20 69 54 227<br />
Contractual-teachers<br />
Gender & caste distribution of teachers*<br />
School category Avg. No. of Tchs.<br />
Primary only<br />
2.9<br />
Primary with Upper Prim.<br />
8.4<br />
Prim.with U.P.Sec/Hr.Sec<br />
8.9<br />
Upper Primary only<br />
6.3<br />
U. Primary with Sec./Hr.S<br />
8.8<br />
Enrolment by medium of instructions*<br />
No. of schools by type of building*<br />
Post<br />
No<br />
Graduate M. Phil. Others response<br />
Enrolment<br />
All With disability<br />
Girls Boys Girls<br />
3,537 40 48<br />
3,401 47 26<br />
3,368 53 12<br />
3,226 31 15<br />
3,112 32 20<br />
3,824 43 21<br />
3,688 21 11<br />
4,309 36 23<br />
28,465 303 176<br />
Pucca<br />
Partially<br />
Multiple No<br />
Pucca Kuchcha Tent Type Building<br />
412 0 0 0 9 10<br />
14 0 0 0 0 0<br />
31 0 0 0 1 2<br />
55 1 0 0 1 5<br />
75 0 0 0 3 1<br />
333 12 5<br />
44 1 0 0<br />
93 1 0 0<br />
175 9 4 0<br />
318 5 1 0<br />
7 4 2 64 32 1 0 0<br />
Total<br />
Regular teachers Contractual-teachers SC teachers ST teachers<br />
Male Female No res Male Female No res Male Female Male Female<br />
1239 262 880 0 11 86 0 75 208 2 13<br />
126 15 111 0 0 0 0 0 5 0 0<br />
302 36 257 0 0 9 0 0 11 0 2<br />
395 118 275 0 2 0 0 27 47 2 0<br />
696 184 510 0 0 2 0 33 70 0 2<br />
% Total Primary Upper Primary % Schools recvd.<br />
Grossness<br />
(Previous year)<br />
21.1<br />
33.5<br />
School T L M<br />
Hindi Others Marathi dev. grant grant<br />
Examination results<br />
(Previous academic year)<br />
Terminal % % Passed<br />
0 grade Passed with >60%<br />
V boys 98.0 34.1<br />
V girls 98.7 41.9<br />
V<strong>II</strong>I boys 58.4 18.4<br />
V<strong>II</strong>I girls 62.9 19.2<br />
%Teachers recvd.<br />
In-service training<br />
Male Female<br />
12.5 12.5<br />
0.0 0.0<br />
8.3 2.3<br />
18.3 17.5<br />
24.5 16.0<br />
Incentives : Number of beneficiaries<br />
(Previous academic year)<br />
Category Punjabi English<br />
Incentive<br />
P. only<br />
29143<br />
139<br />
279<br />
0<br />
83 91.2 89.6 Type<br />
P + UP<br />
1628<br />
848<br />
288<br />
198<br />
0 0.0 0.0 Text books<br />
P+sec/hs<br />
2926<br />
4333<br />
893<br />
224<br />
0 8.8 8.8 Uniform<br />
U.P. only<br />
5323<br />
0<br />
0<br />
0<br />
0 81.0 85.7 Attendance<br />
UP+Sec<br />
15055<br />
0<br />
14<br />
0<br />
0 89.9 89.9 Stationery<br />
# = not applicable na = not available * Some totals may not match due to no response in classificatory data items<br />
Primary Upper primary<br />
Boys Girls Boys Girls<br />
10828 13843 7157 9419<br />
36 59 65 77<br />
156 5206 1244 1492<br />
342 394 42 28<br />
453<br />
Punjab


