

Volume II - DISE
Volume II - DISE
Volume II - DISE

Create successful ePaper yourself
Turn your PDF publications into a flip-book with our unique Google optimized e-Paper software.
District<br />
HATHRAS<br />
State Uttar Pradesh<br />
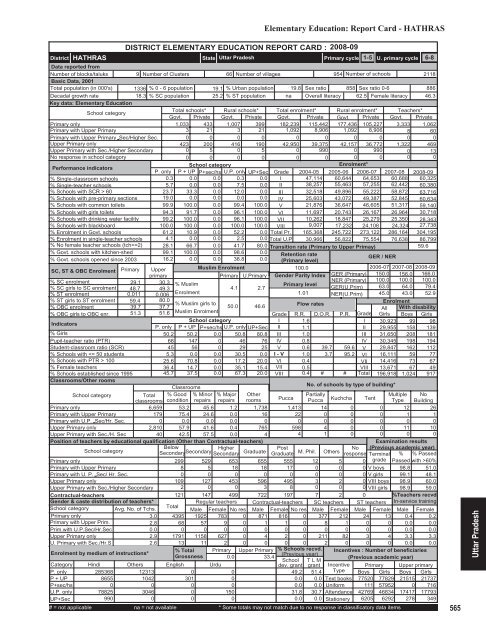
Elementary Education: Report Card - HATHRAS<br />
DISTRICT ELEMENTARY EDUCATION REPORT CARD : 2008-09<br />
Primary cycle<br />
1-5 U. primary cycle 6-8<br />
Data reported from<br />
Number of blocks/taluks<br />
9 Number of Clusters 66 Number of villages<br />
954 Number of schools<br />
2118<br />
Basic Data, 2001<br />
Total population (in 000's) 1336 % 0 - 6 population 19.1 % Urban population 19.8 Sex ratio 858 Sex ratio 0-6<br />
886<br />
Decadal growth rate<br />
18.3 % SC population 25.2 % ST population na Overall literacy 62.5 Female literacy 46.3<br />
Key data: Elementary Education<br />
School category<br />
Total schools* Rural schools* Total enrolment* Rural enrolment* Teachers*<br />
Govt. Private Govt. Private Govt. Private Govt. Private Govt. Private<br />
Primary only<br />
1,033 433 1,007 399 182,239 115,442 177,436 105,227 3,333 1,062<br />
Primary with Upper Primary<br />
3 21 3 21 1,092 8,906 1,092 8,906 8 60<br />
Primary with Upper Primary Sec/Higher Sec.<br />
0 0 0 0 0 0 0 0 0 0<br />
Upper Primary only<br />
423 200 416 190 42,950 39,375 42,157 36,772 1,322 469<br />
Upper Primary with Sec./Higher Secondary<br />
0 5 0 5 0 990 0 990 0 13<br />
No response in school category<br />
0 0 0 0 0 0 0 0 0 0<br />
Performance indicators<br />
School category<br />
Enrolment*<br />
P. only P + UP P+sec/hs U.P. only UP+Sec Grade 2004-05 2005-06 2006-07 2007-08 2008-09<br />
% Single-classroom schools<br />
0.3 0.0 0.0 0.3 0.0 I 47,114 60,644 64,653 60,688 60,325<br />
% Single-teacher schools<br />
5.7 0.0 0.0 7.5 0.0 <strong>II</strong> 38,257 55,463 57,255 62,442 60,380<br />
% Schools with SCR > 60<br />
23.7 33.3 0.0 12.0 0.0 <strong>II</strong>I 32,518 49,896 55,222 58,872 63,716<br />
% Schools with pre-primary sections 19.0 0.0 0.0 0.0 0.0 IV 25,603 43,072 49,387 52,845 60,634<br />
% Schools with common toilets 99.9 100.0 0.0 99.4 100.0 V 21,876 36,647 46,605 51,317 59,140<br />
% Schools with girls toilets 94.3 91.7 0.0 96.1 100.0 VI 11,697 20,743 26,167 26,964 30,718<br />
% Schools with drinking water facility 99.2 100.0 0.0 96.1 100.0 V<strong>II</strong> 10,262 18,847 25,279 25,350 28,343<br />
% Schools with blackboard<br />
100.0 100.0 0.0 100.0 100.0 V<strong>II</strong>I 9,007 17,232 24,108 24,324 27,738<br />
% Enrolment in Govt. schools 61.2 10.9 0.0 52.2 0.0 Total Pr. 165,368 245,722 273,122 286,164 304,195<br />
% Enrolment in single-teacher schools 4.1 0.0 0.0 2.5 0.0 Total U.P 30,966 56,822 75,554 76,638 86,799<br />
% No female teacher schools (tch>=2) 28.1 66.7 0.0 41.7 80.0 Transition rate (Primary to Upper Primay)<br />
59.6<br />
% Govt. schools with kitchen-shed 99.1 100.0 0.0 98.6 0.0 Retention rate<br />
% Govt. schools opened since 2003 16.2 0.0 0.0 38.8 0.0 (Primary level)<br />
/ NER<br />
GER<br />
SC, ST & OBC Enrolment Primary Upper<br />
Muslim Enrolment<br />
100.0<br />
2006-07 2007-08 2008-09<br />
primary<br />
Primary U.Primary Gender Parity Index GER (Primary) 150.0 156.0 166.0<br />
% SC enrolment<br />
% SC girls to SC enrolment<br />
% ST enrolment<br />
% ST girls to ST enrolment<br />
% OBC enrolment<br />
% OBC girls to OBC enr.<br />
Indicators<br />
% Girls<br />
Pupil-teacher ratio (PTR)<br />
Student-classroom ratio (SCR)<br />
% Schools with 100<br />
% Female teachers<br />
% Schools established since 1995<br />
Classrooms/Other rooms<br />
29.1 30.3<br />
NER (Primary) 100.0<br />
% Muslim<br />
Primary level<br />
48.7 49.3<br />
4.1 2.7<br />
GER(U.Prim) 63.0<br />
0.011 0.006<br />
Enrolment<br />
1.01 NER(U.Prim) 45.0<br />
59.4 80.0<br />
% Muslim girls to<br />
50.0 46.6<br />
Flow rates<br />
39.7 37.7<br />
51.3 51.6 Muslim Enrolment<br />
Grade R.R. D.O.R. P.R. Grade<br />
School category<br />
I 1.6<br />
I<br />
P. only P + UP P+sec/hs U.P. only UP+Sec <strong>II</strong> 1.1<br />
<strong>II</strong><br />
50.2 50.2 0.0 50.8 80.8 <strong>II</strong>I 1.0<br />
<strong>II</strong>I<br />
68 147 0 46 76 IV 0.8<br />
IV<br />
45 56 0 29 25 V 0.6 39.7 59.6 V<br />
5.3 0.0 0.0 30.5 0.0 I - V 1.0 3.7 95.2 VI<br />
25.6 70.8 0.0 17.2 20.0 VI 0.4<br />
V<strong>II</strong><br />
36.4 14.7 0.0 35.1 15.4 V<strong>II</strong> 0.5<br />
V<strong>II</strong>I<br />
45.7 37.5 0.0 67.3 20.0 V<strong>II</strong>I 0.4 # # Total<br />
Classrooms<br />
School category<br />
Total<br />
classrooms<br />
% Good<br />
condition<br />
% Minor<br />
repairs<br />
% Major<br />
repairs<br />
Other<br />
rooms<br />
Primary only<br />
6,659 53.2 45.6 1.2 1,738<br />
Primary with Upper Primary<br />
179 75.4 24.6 0.0 16<br />
Primary with U.P. Sec/Hr. Sec.<br />
0 0.0 0.0 0.0<br />
0<br />
Upper Primary only<br />
2,810 57.9 41.6 0.4 765<br />
Upper Primary with Sec./H. Sec<br />
40 42.5 57.5 0.0<br />
4<br />
Position of teachers by educational qualification (Other than Contractual-teachers)<br />
School category<br />
Below<br />
Secondary Higher<br />
Secondary<br />
Secondary Graduate<br />
Primary only<br />
299 529 653 655<br />
Primary with Upper Primary<br />
8 5 18 18<br />
Primary with U. P. Sec/ Hr. Sec.<br />
0 0 0 0<br />
Upper Primary only<br />
109 127 453 596<br />
Upper Primary with Sec./Higher Secondary<br />
2 0 0 3<br />
Contractual-teachers<br />
Gender & caste distribution of teachers*<br />
School category Avg. No. of Tchs.<br />
Primary only<br />
3.0<br />
Primary with Upper Prim.<br />
2.8<br />
Prim.with U.P.Sec/Hr.Sec<br />
0.0<br />
Upper Primary only<br />
2.9<br />
U. Primary with Sec./Hr.S<br />
2.6<br />
Enrolment by medium of instructions*<br />
No. of schools by type of building*<br />
Post<br />
No<br />
Graduate M. Phil. Others response<br />
100.0<br />
64.0<br />
43.0<br />
100.0<br />
79.4<br />
52.9<br />
Enrolment<br />
All With disability<br />
Girls Boys Girls<br />
30,923 99 98<br />
29,955 158 139<br />
31,650 208 181<br />
30,345 198 194<br />
29,847 162 112<br />
16,111 59 77<br />
14,416 73 67<br />
13,671 67 49<br />
196,918 1,024 917<br />
Pucca<br />
Partially<br />
Multiple No<br />
Pucca Kuchcha Tent Type Building<br />
1,413 14 0 0 12 26<br />
22 0 0 0 1 1<br />
0 0 0 0 0 0<br />
598 4 0 0 11 10<br />
4 1 0 0 0 0<br />
555 12 5<br />
17 0 0 0<br />
0 0 0 0<br />
495 3 2 0<br />
8 0 0 0<br />
121 147 499 722 197 7 2 0<br />
Total<br />
Regular teachers Contractual-teachers SC teachers ST teachers<br />
Male Female No res Male Female No res Male Female Male Female<br />
4395 1925 783 0 871 816 0 377 212 24 13<br />
68 57 9 0 1 1 0 8 1 0 0<br />
0 0 0 0 0 0 0 0 0 0 0<br />
1791 1158 627 0 4 2 0 211 82 3 4<br />
13 11 2 0 0 0 0 2 0 0 0<br />
% Total Primary Upper Primary % Schools recvd.<br />
Grossness<br />
(Previous year)<br />
0.0<br />
33.4<br />
School T L M<br />
English Urdu<br />
dev. grant grant<br />
Examination results<br />
(Previous academic year)<br />
Terminal % % Passed<br />
0 grade Passed with >60%<br />
V boys 98.8 51.0<br />
V girls 99.1 48.1<br />
V<strong>II</strong>I boys 98.9 60.0<br />
V<strong>II</strong>I girls 98.9 59.0<br />
%Teachers recvd.<br />
In-service training<br />
Male Female<br />
0.4 0.2<br />
0.0 0.0<br />
0.0 0.0<br />
3.3 3.3<br />
0.0 0.0<br />
Incentives : Number of beneficiaries<br />
(Previous academic year)<br />
Category<br />
P. only<br />
Hindi<br />
285368<br />
Others<br />
12313<br />
0<br />
0<br />
49.2 51.4<br />
Incentive<br />
Type<br />
P + UP<br />
8655<br />
1042<br />
301<br />
0<br />
0.0 0.0 Text books<br />
P+sec/hs<br />
0<br />
0<br />
0<br />
0<br />
0.0 0.0 Uniform<br />
U.P. only 78825<br />
3046<br />
0<br />
150<br />
31.8 30.7 Attendance<br />
UP+Sec<br />
990<br />
0<br />
0<br />
0<br />
0.0 0.0 Stationery<br />
# = not applicable na = not available * Some totals may not match due to no response in classificatory data items<br />
Primary Upper primary<br />
Boys Girls Boys Girls<br />
77520 77829 21515 21737<br />
111 57952 0 716<br />
42769 46834 17417 17793<br />
6205 6292 278 349<br />
565<br />
Uttar Pradesh


