

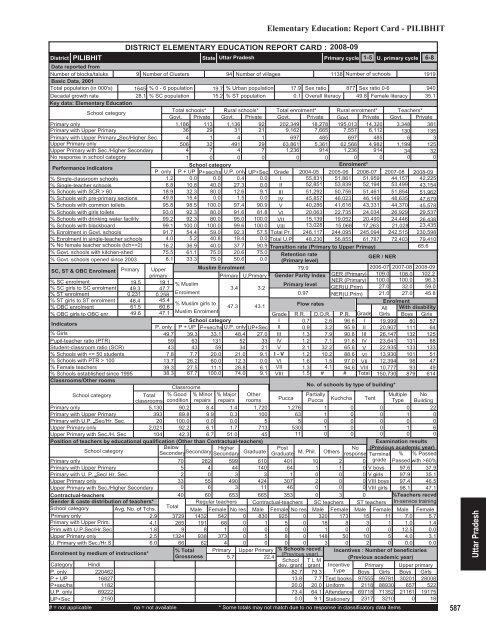
Volume II - DISE
Volume II - DISE
Volume II - DISE

Create successful ePaper yourself
Turn your PDF publications into a flip-book with our unique Google optimized e-Paper software.
District<br />
PILIBHIT<br />
State Uttar Pradesh<br />
Elementary Education: Report Card - PILIBHIT<br />
DISTRICT ELEMENTARY EDUCATION REPORT CARD : 2008-09<br />
Primary cycle<br />
1-5 U. primary cycle 6-8<br />
Data reported from<br />
Number of blocks/taluks<br />
9 Number of Clusters 94 Number of villages<br />
1138 Number of schools<br />
1919<br />
Basic Data, 2001<br />
Total population (in 000's) 1645 % 0 - 6 population 19.7 % Urban population 17.9 Sex ratio 877 Sex ratio 0-6<br />
940<br />
Decadal growth rate<br />
28.1 % SC population 15.2 % ST population<br />
0.1 Overall literacy 49.8 Female literacy 35.1<br />
Key data: Elementary Education<br />
School category<br />
Total schools* Rural schools* Total enrolment* Rural enrolment* Teachers*<br />
Govt. Private Govt. Private Govt. Private Govt. Private Govt. Private<br />
Primary only<br />
1,186 113 1,136 92 202,349 18,278 195,013 14,320 3,348 381<br />
Primary with Upper Primary<br />
36 29 31 21 9,162 7,665 7,557 6,112 130 135<br />
Primary with Upper Primary Sec/Higher Sec.<br />
4 1 4 1 697 485 697 485 6 3<br />
Upper Primary only<br />
506 32 491 29 63,861 5,361 62,566 4,982 1,199 125<br />
Upper Primary with Sec./Higher Secondary<br />
4 7 4 7 1,236 914 1,236 914 34 32<br />
No response in school category<br />
1 0 0 0 0 0 0 0 0 0<br />
Performance indicators<br />
School category<br />
Enrolment*<br />
P. only P + UP P+sec/hs U.P. only UP+Sec Grade 2004-05 2005-06 2006-07 2007-08 2008-09<br />
% Single-classroom schools<br />
1.2 0.0 0.0 0.4 0.0 I 55,831 51,861 51,959 44,157 42,225<br />
% Single-teacher schools<br />
6.8 10.8 40.0 27.3 0.0 <strong>II</strong> 52,851 53,839 52,194 53,499 43,154<br />
% Schools with SCR > 60<br />
18.9 32.3 80.0 12.6 9.1 <strong>II</strong>I 51,292 50,756 51,461 51,854 51,962<br />
% Schools with pre-primary sections 49.8 15.4 0.0 1.5 0.0 IV 45,857 46,023 46,149 48,635 47,679<br />
% Schools with common toilets 95.8 98.5 100.0 97.4 90.9 V 40,286 41,616 43,331 44,370 45,578<br />
% Schools with girls toilets 93.0 92.3 80.0 91.6 81.8 VI 20,063 22,735 24,034 26,929 29,537<br />
% Schools with drinking water facility 99.2 92.3 80.0 95.0 100.0 V<strong>II</strong> 15,139 19,052 20,490 24,446 26,438<br />
% Schools with blackboard<br />
99.1 100.0 100.0 99.6 100.0 V<strong>II</strong>I 13,028 15,068 17,263 21,028 23,435<br />
% Enrolment in Govt. schools 91.7 54.4 59.0 92.3 57.5 Total Pr. 246,117 244,095 245,094 242,515 230,598<br />
% Enrolment in single-teacher schools 4.0 5.2 40.8 19.4 0.0 Total U.P 48,230 56,855 61,787 72,403 79,410<br />
% No female teacher schools (tch>=2) 16.2 36.9 40.0 37.7 90.9 Transition rate (Primary to Upper Primay)<br />
65.6<br />
% Govt. schools with kitchen-shed 75.5 61.1 75.0 20.6 75.0 Retention rate<br />
% Govt. schools opened since 2003 8.1 33.3 75.0 50.6 0.0 (Primary level)<br />
/ NER<br />
GER<br />
SC, ST & OBC Enrolment Primary Upper<br />
Muslim Enrolment<br />
79.9<br />
2006-07 2007-08 2008-09<br />
primary<br />
Primary U.Primary Gender Parity Index GER (Primary) 109.0 108.0 102.2<br />
% SC enrolment<br />
% SC girls to SC enrolment<br />
% ST enrolment<br />
% ST girls to ST enrolment<br />
% OBC enrolment<br />
% OBC girls to OBC enr.<br />
Indicators<br />
% Girls<br />
Pupil-teacher ratio (PTR)<br />
Student-classroom ratio (SCR)<br />
% Schools with 100<br />
% Female teachers<br />
% Schools established since 1995<br />
Classrooms/Other rooms<br />
19.5 19.1 % Muslim<br />
Primary level<br />
49.3 47.7<br />
3.4 3.2<br />
0.231 0.258<br />
Enrolment<br />
0.97<br />
48.4 45.4<br />
% Muslim girls to<br />
47.3 43.1<br />
Flow rates<br />
61.5 60.6<br />
49.6 47.1 Muslim Enrolment<br />
Grade<br />
School category<br />
I<br />
P. only P + UP P+sec/hs U.P. only UP+Sec <strong>II</strong><br />
49.7 39.3 33.1 48.4 27.0 <strong>II</strong>I<br />
59 63 131 52 33 IV<br />
43 43 59 34 21 V 2.1<br />
7.8 7.7 20.0 21.0 9.1 I - V 1.2<br />
13.7 26.2 60.0 12.3 0.0 VI 1.6<br />
39.3 27.5 11.1 28.8 6.1 V<strong>II</strong> 1.3<br />
38.3 67.7 100.0 74.0 9.1 V<strong>II</strong>I 1.5<br />
Classrooms<br />
School category<br />
Total<br />
classrooms<br />
% Good<br />
condition<br />
% Minor<br />
repairs<br />
% Major<br />
repairs<br />
Other<br />
rooms<br />
Primary only<br />
5,130 90.2 8.4 1.4 1,720<br />
Primary with Upper Primary<br />
393 89.8 9.9 0.3 100<br />
Primary with U.P. Sec/Hr. Sec.<br />
20 100.0 0.0 0.0<br />
5<br />
Upper Primary only<br />
2,021 92.2 6.1 1.7 713<br />
Upper Primary with Sec./H. Sec<br />
104 42.3 6.7 51.0 45<br />
Position of teachers by educational qualification (Other than Contractual-teachers)<br />
School category<br />
Below<br />
Secondary Higher<br />
Secondary<br />
Secondary Graduate<br />
Primary only<br />
70 282 599 610<br />
Primary with Upper Primary<br />
5 4 44 140<br />
Primary with U. P. Sec/ Hr. Sec.<br />
2 0 3 3<br />
Upper Primary only<br />
33 55 490 424<br />
Upper Primary with Sec./Higher Secondary<br />
0 6 3 11<br />
Contractual-teachers<br />
Gender & caste distribution of teachers*<br />
School category Avg. No. of Tchs.<br />
Primary only<br />
2.9<br />
Primary with Upper Prim.<br />
4.1<br />
Prim.with U.P.Sec/Hr.Sec<br />
1.8<br />
Upper Primary only<br />
2.5<br />
U. Primary with Sec./Hr.S<br />
6.0<br />
Enrolment by medium of instructions*<br />
NER (Primary)<br />
GER(U.Prim)<br />
NER(U.Prim)<br />
Grade<br />
2.6 96.6 I<br />
3.2 95.9 <strong>II</strong><br />
7.9 90.8 <strong>II</strong>I<br />
7.1 91.8 IV<br />
32.2 65.6 V<br />
10.2 88.6 VI<br />
1.5 97.0 V<strong>II</strong><br />
4.1 94.6 V<strong>II</strong>I<br />
# # Total<br />
R.R. D.O.R. P.R.<br />
0.7<br />
0.9<br />
1.3<br />
1.2<br />
100.0<br />
27.0<br />
21.0<br />
No. of schools by type of building*<br />
Post<br />
No<br />
Graduate M. Phil. Others response<br />
100.0<br />
32.0<br />
27.0<br />
96.3<br />
59.0<br />
45.8<br />
Enrolment<br />
All With disability<br />
Girls Boys Girls<br />
19,999 80 57<br />
20,907 111 64<br />
26,147 132 125<br />
23,641 131 88<br />
22,935 133 133<br />
13,930 101 51<br />
12,394 98 47<br />
10,777 93 49<br />
150,730 879 614<br />
Pucca<br />
Partially<br />
Multiple No<br />
Pucca Kuchcha Tent Type Building<br />
1,276 1 0 0 0 22<br />
63 1 0 0 1 0<br />
5 0 0 0 0 0<br />
530 1 0 0 1 6<br />
11 0 0 0 0 0<br />
401 10 2<br />
64 1 1 0<br />
1 0 0 0<br />
307 2 0 0<br />
46 0 0 0<br />
40 60 653 665 353 0 3 0<br />
Total<br />
Regular teachers Contractual-teachers SC teachers ST teachers<br />
Male Female No res Male Female No res Male Female Male Female<br />
3729 1432 542 0 830 925 0 320 173 15 11<br />
265 191 68 0 1 5 0 18 8 3 1<br />
9 8 1 0 0 0 0 1 0 0 0<br />
1324 938 373 0 5 8 0 148 50 10 5<br />
66 62 4 0 0 0 0 3 0 2 0<br />
% Total Primary Upper Primary % Schools recvd.<br />
Grossness<br />
(Previous year)<br />
5.7<br />
22.4<br />
School T L M<br />
dev. grant grant<br />
Examination results<br />
(Previous academic year)<br />
Terminal % % Passed<br />
0 grade Passed with >60%<br />
V boys 97.6 37.9<br />
V girls 97.9 35.1<br />
V<strong>II</strong>I boys 97.4 46.5<br />
V<strong>II</strong>I girls 98.1 47.1<br />
%Teachers recvd.<br />
In-service training<br />
Male Female<br />
7.0 5.7<br />
1.0 1.4<br />
12.5 0.0<br />
4.0 3.1<br />
0.0 0.0<br />
Incentives : Number of beneficiaries<br />
(Previous academic year)<br />
Category<br />
P. only<br />
Hindi<br />
220462<br />
82.7 79.3<br />
Incentive<br />
Type<br />
P + UP<br />
16827<br />
13.8 7.7 Text books<br />
P+sec/hs<br />
1182<br />
20.0 20.0 Uniform<br />
U.P. only 69222<br />
73.4 64.1 Attendance<br />
UP+Sec<br />
2150<br />
0.0 9.1 Stationery<br />
# = not applicable na = not available * Some totals may not match due to no response in classificatory data items<br />
Primary Upper primary<br />
Boys Girls Boys Girls<br />
97555 99781 30201 28008<br />
2118 88930 657 522<br />
69718 71352 21161 19175<br />
2317 3210 0 18<br />
587<br />
Uttar Pradesh


