

Volume II - DISE
Volume II - DISE
Volume II - DISE

Create successful ePaper yourself
Turn your PDF publications into a flip-book with our unique Google optimized e-Paper software.
District<br />
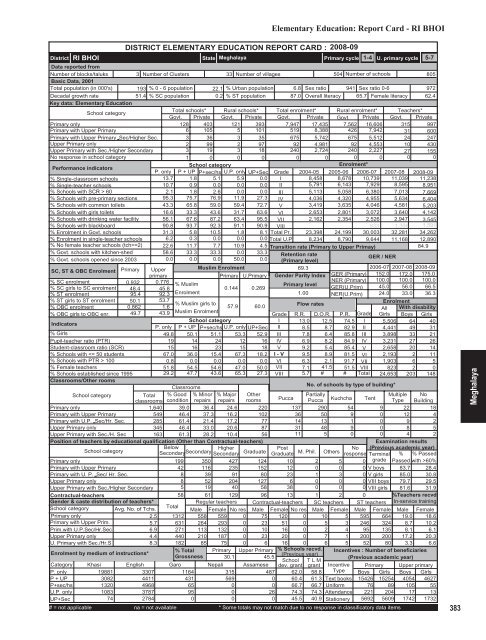
RI BHOI<br />
DISTRICT ELEMENTARY EDUCATION REPORT CARD : 2008-09<br />
State Meghalaya<br />
Elementary Education: Report Card - RI BHOI<br />
Primary cycle<br />
1-4 U. primary cycle 5-7<br />
Data reported from<br />
Number of blocks/taluks<br />
3 Number of Clusters 33 Number of villages<br />
504 Number of schools<br />
805<br />
Basic Data, 2001<br />
Total population (in 000's) 193 % 0 - 6 population 22.1 % Urban population 6.8 Sex ratio 941 Sex ratio 0-6<br />
972<br />
Decadal growth rate<br />
51.4 % SC population 0.2 % ST population 87.0 Overall literacy 65.7 Female literacy 62.4<br />
Key data: Elementary Education<br />
School category<br />
Total schools* Rural schools* Total enrolment* Rural enrolment* Teachers*<br />
Govt. Private Govt. Private Govt. Private Govt. Private Govt. Private<br />
Primary only<br />
128 403 121 393 7,947 17,435 7,562 16,606 315 997<br />
Primary with Upper Primary<br />
6 105 5 101 519 8,388 426 7,942 31 600<br />
Primary with Upper Primary Sec/Higher Sec.<br />
3 36 3 35 675 5,742 675 5,512 24 247<br />
Upper Primary only<br />
2 99 2 97 92 4,981 92 4,553 10 430<br />
Upper Primary with Sec./Higher Secondary<br />
3 19 3 18 240 2,724 240 2,227 27 155<br />
No response in school category<br />
1 0 0 0 0 0 0 0 0 0<br />
Performance indicators<br />
School category<br />
Enrolment*<br />
P. only P + UP P+sec/hs U.P. only UP+Sec Grade 2004-05 2005-06 2006-07 2007-08 2008-09<br />
% Single-classroom schools<br />
13.7 1.8 5.1 5.9 0.0 I<br />
8,458 8,678 10,739 11,039 11,238<br />
% Single-teacher schools<br />
10.7 0.9 0.0 0.0 0.0 <strong>II</strong> 5,791 6,143 7,929 8,595 8,951<br />
% Schools with SCR > 60<br />
2.1 1.8 2.6 0.0 0.0 <strong>II</strong>I 5,113 5,058 6,380 7,013 7,669<br />
% Schools with pre-primary sections 95.3 75.7 76.9 11.9 27.3 IV 4,036 4,320 4,955 5,634 6,404<br />
% Schools with common toilets 43.3 65.8 59.0 59.4 72.7 V 3,419 3,635 4,046 4,581 5,203<br />
% Schools with girls toilets 16.6 33.3 43.6 31.7 63.6 VI 2,653 2,801 3,072 3,640 4,142<br />
% Schools with drinking water facility 56.1 67.6 87.2 63.4 95.5 V<strong>II</strong> 2,162 2,354 2,526 2,947 3,545<br />
% Schools with blackboard<br />
90.8 93.7 92.3 91.1 90.9 V<strong>II</strong>I<br />
833 1,306 1,591<br />
% Enrolment in Govt. schools 31.3 5.8 10.5 1.8 8.1 Total Pr. 23,398 24,199 30,003 32,281 34,262<br />
% Enrolment in single-teacher schools 6.2 0.3 0.0 0.0 0.0 Total U.P 8,234 8,790 9,644 11,168 12,890<br />
% No female teacher schools (tch>=2) 22.6 11.7 7.7 10.9 4.5 Transition rate (Primary to Upper Primay)<br />
84.9<br />
% Govt. schools with kitchen-shed 58.6 33.3 33.3 0.0 33.3 Retention rate<br />
% Govt. schools opened since 2003 0.0 0.0 0.0 50.0 0.0 (Primary level)<br />
/ NER<br />
GER<br />
SC, ST & OBC Enrolment Primary Upper<br />
Muslim Enrolment<br />
69.3<br />
2006-07 2007-08 2008-09<br />
primary<br />
Primary U.Primary Gender Parity Index GER (Primary) 152.0 172.0 175.0<br />
% SC enrolment<br />
% SC girls to SC enrolment<br />
% ST enrolment<br />
% ST girls to ST enrolment<br />
% OBC enrolment<br />
% OBC girls to OBC enr.<br />
Indicators<br />
% Girls<br />
Pupil-teacher ratio (PTR)<br />
Student-classroom ratio (SCR)<br />
% Schools with 100<br />
% Female teachers<br />
% Schools established since 1995<br />
Classrooms/Other rooms<br />
0.932 0.776<br />
% Muslim<br />
Primary level<br />
48.4 45.8<br />
0.144 0.269<br />
95.4 92.3 Enrolment<br />
1.00<br />
50.1 53.7<br />
% Muslim girls to<br />
57.9 60.0<br />
Flow rates<br />
0.862 1.6<br />
49.7 43.9 Muslim Enrolment<br />
Grade<br />
School category<br />
I<br />
P. only P + UP P+sec/hs U.P. only UP+Sec <strong>II</strong><br />
49.8 50.1 51.1 53.3 52.9 <strong>II</strong>I<br />
19 14 24 12 16 IV<br />
15 16 23 15 18 V<br />
67.0 36.0 15.4 67.3 18.2 I - V<br />
0.8 0.0 0.0 0.0 0.0 VI<br />
51.8 54.5 54.6 47.0 50.0 V<strong>II</strong><br />
29.2 47.7 43.6 65.3 27.3 V<strong>II</strong>I<br />
Classrooms<br />
School category<br />
Total<br />
classrooms<br />
% Good<br />
condition<br />
% Minor<br />
repairs<br />
% Major<br />
repairs<br />
Other<br />
rooms<br />
Primary only<br />
1,640 39.0 36.4 24.6 220<br />
Primary with Upper Primary<br />
549 46.4 37.3 16.2 102<br />
Primary with U.P. Sec/Hr. Sec.<br />
285 61.4 21.4 17.2 77<br />
Upper Primary only<br />
345 46.4 33.0 20.6 87<br />
Upper Primary with Sec./H. Sec<br />
163 61.3 28.2 10.4 56<br />
Position of teachers by educational qualification (Other than Contractual-teachers)<br />
School category<br />
Below<br />
Secondary Higher<br />
Secondary<br />
Secondary Graduate<br />
Primary only<br />
199 350 427 124<br />
Primary with Upper Primary<br />
42 116 235 152<br />
Primary with U. P. Sec/ Hr. Sec.<br />
8 39 91 80<br />
Upper Primary only<br />
8 52 204 127<br />
Upper Primary with Sec./Higher Secondary<br />
5 19 40 58<br />
Contractual-teachers<br />
Gender & caste distribution of teachers*<br />
School category Avg. No. of Tchs.<br />
Primary only<br />
2.5<br />
Primary with Upper Prim.<br />
5.7<br />
Prim.with U.P.Sec/Hr.Sec<br />
6.9<br />
Upper Primary only<br />
4.4<br />
U. Primary with Sec./Hr.S<br />
8.3<br />
Enrolment by medium of instructions*<br />
NER (Primary)<br />
GER(U.Prim)<br />
NER(U.Prim)<br />
R.R. D.O.R. P.R. Grade<br />
13.0 12.5 74.5 I<br />
8.5 8.7 82.9 <strong>II</strong><br />
7.8 6.4 85.8 <strong>II</strong>I<br />
6.9 8.2 84.9 IV<br />
9.2 5.4 85.4 V<br />
9.5 8.9 81.5 VI<br />
6.3 2.1 91.7 V<strong>II</strong><br />
7.1 41.5 51.5 V<strong>II</strong>I<br />
5.7 # # Total<br />
100.0<br />
45.0<br />
24.0<br />
No. of schools by type of building*<br />
Post<br />
No<br />
Graduate M. Phil. Others response<br />
100.0<br />
56.0<br />
33.0<br />
100.0<br />
66.5<br />
36.3<br />
Enrolment<br />
All With disability<br />
Girls Boys Girls<br />
5,506 64 40<br />
4,441 49 31<br />
3,898 33 21<br />
3,231 27 26<br />
2,658 20 14<br />
2,193 2 11<br />
1,903 6 5<br />
823 2 0<br />
24,653 203 148<br />
Pucca<br />
Partially<br />
Multiple No<br />
Pucca Kuchcha Tent Type Building<br />
137 290 54 9 22 18<br />
36 50 9 0 12 4<br />
14 13 1 0 9 2<br />
31 48 9 0 8 5<br />
11 5 0 0 4 2<br />
10 2 5<br />
12 0 0 0<br />
23 1 3 0<br />
6 0 0 0<br />
38 0 0 0<br />
58 61 129 96 13 1 2 0<br />
Total<br />
Regular teachers Contractual-teachers SC teachers ST teachers<br />
Male Female No res Male Female No res Male Female Male Female<br />
1312 558 559 0 75 120 0 10 5 595 664<br />
631 264 293 0 23 51 0 5 3 246 324<br />
271 113 132 0 10 16 0 2 4 95 135<br />
440 210 187 0 23 20 0 7 1 200 200<br />
182 85 75 0 6 16 0 6 5 52 80<br />
% Total Primary Upper Primary % Schools recvd.<br />
Grossness<br />
(Previous year)<br />
30.1<br />
45.5<br />
School T L M<br />
Garo Nepali<br />
dev. grant grant<br />
Examination results<br />
(Previous academic year)<br />
Terminal % % Passed<br />
0 grade Passed with >60%<br />
V boys 83.7 28.4<br />
V girls 85.0 30.8<br />
V<strong>II</strong>I boys 79.7 29.5<br />
V<strong>II</strong>I girls 81.6 31.9<br />
%Teachers recvd.<br />
In-service training<br />
Male Female<br />
19.0 18.6<br />
8.7 10.2<br />
8.1 6.1<br />
17.2 20.3<br />
3.3 6.6<br />
Incentives : Number of beneficiaries<br />
(Previous academic year)<br />
Category<br />
P. only<br />
Khasi<br />
19881<br />
English<br />
3307<br />
1164<br />
315<br />
Assamese<br />
487 62.0 58.8<br />
Incentive<br />
Type<br />
P + UP<br />
3082<br />
4411<br />
431<br />
569<br />
0 60.4 61.3 Text books<br />
P+sec/hs<br />
1320<br />
4968<br />
65<br />
0<br />
0 66.7 66.7 Uniform<br />
U.P. only<br />
1083<br />
3787<br />
95<br />
0<br />
26 74.3 74.3 Attendance<br />
UP+Sec<br />
74<br />
2784<br />
0<br />
0<br />
0 45.5 40.9 Stationery<br />
# = not applicable na = not available * Some totals may not match due to no response in classificatory data items<br />
Primary Upper primary<br />
Boys Girls Boys Girls<br />
15426 15254 4054 4627<br />
76 89 105 55<br />
221 204 17 13<br />
5692 5609 1742 1732<br />
383<br />
Meghalaya


