

Volume II - DISE
Volume II - DISE
Volume II - DISE

You also want an ePaper? Increase the reach of your titles
YUMPU automatically turns print PDFs into web optimized ePapers that Google loves.
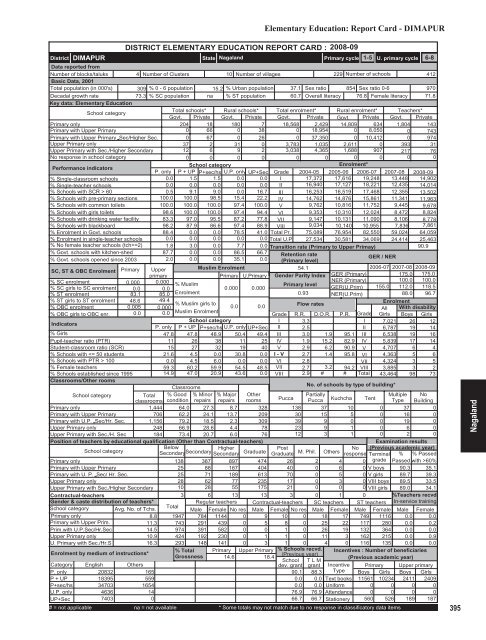
District<br />
DIMAPUR<br />
State Nagaland<br />
Elementary Education: Report Card - DIMAPUR<br />
DISTRICT ELEMENTARY EDUCATION REPORT CARD : 2008-09<br />
Primary cycle<br />
1-5 U. primary cycle 6-8<br />
Data reported from<br />
Number of blocks/taluks<br />
4 Number of Clusters 10 Number of villages<br />
229 Number of schools<br />
412<br />
Basic Data, 2001<br />
Total population (in 000's) 309 % 0 - 6 population 15.2 % Urban population 37.1 Sex ratio 854 Sex ratio 0-6<br />
970<br />
Decadal growth rate<br />
73.3 % SC population na % ST population 60.7 Overall literacy 76.8 Female literacy 71.8<br />
Key data: Elementary Education<br />
School category<br />
Total schools* Rural schools* Total enrolment* Rural enrolment* Teachers*<br />
Govt. Private Govt. Private Govt. Private Govt. Private Govt. Private<br />
Primary only<br />
204 18 180 7 18,568 2,429 14,809 634 1,804 143<br />
Primary with Upper Primary<br />
0 66 0 38 0 18,954 0 8,050 0 743<br />
Primary with Upper Primary Sec/Higher Sec.<br />
0 67 0 26 0 37,350 0 10,412 0 974<br />
Upper Primary only<br />
37 2 31 0 3,783 1,035 2,611 0 393 31<br />
Upper Primary with Sec./Higher Secondary<br />
12 6 9 2 3,038 4,365 1,688 907 217 76<br />
No response in school category<br />
0 0 0 0 0 0 0 0 0 0<br />
Performance indicators<br />
School category<br />
Enrolment*<br />
P. only P + UP P+sec/hs U.P. only UP+Sec Grade 2004-05 2005-06 2006-07 2007-08 2008-09<br />
% Single-classroom schools<br />
0.0 1.5 1.5 0.0 0.0 I 17,372 17,616 19,248 13,448 14,902<br />
% Single-teacher schools<br />
0.0 0.0 0.0 0.0 0.0 <strong>II</strong> 16,940 17,127 18,221 12,435 14,014<br />
% Schools with SCR > 60<br />
0.5 9.1 9.0 0.0 16.7 <strong>II</strong>I 16,253 16,519 17,468 12,355 13,502<br />
% Schools with pre-primary sections 100.0 100.0 98.5 15.4 22.2 IV 14,762 14,876 15,861 11,341 11,963<br />
% Schools with common toilets 100.0 100.0 100.0 97.4 100.0 V 9,762 10,816 11,752 9,445 9,678<br />
% Schools with girls toilets 98.6 100.0 100.0 97.4 94.4 VI 9,353 10,310 12,024 8,472 8,824<br />
% Schools with drinking water facility 83.3 97.0 95.5 87.2 77.8 V<strong>II</strong> 9,147 10,131 11,090 8,106 8,778<br />
% Schools with blackboard<br />
98.2 87.9 86.6 97.4 88.9 V<strong>II</strong>I 9,034 10,140 10,955 7,836 7,861<br />
% Enrolment in Govt. schools 88.4 0.0 0.0 78.5 41.0 Total Pr. 75,089 76,954 82,550 59,024 64,059<br />
% Enrolment in single-teacher schools 0.0 0.0 0.0 0.0 0.0 Total U.P 27,534 30,581 34,069 24,414 25,463<br />
% No female teacher schools (tch>=2) 1.8 3.0 0.0 7.7 0.0 Transition rate (Primary to Upper Primay)<br />
90.9<br />
% Govt. schools with kitchen-shed 87.7 0.0 0.0 86.5 66.7 Retention rate<br />
% Govt. schools opened since 2003 2.0 0.0 0.0 35.1 0.0 (Primary level)<br />
/ NER<br />
GER<br />
SC, ST & OBC Enrolment Primary Upper<br />
Muslim Enrolment<br />
54.1<br />
2006-07 2007-08 2008-09<br />
primary<br />
Primary U.Primary Gender Parity Index GER (Primary)<br />
175.0 175.0<br />
% SC enrolment<br />
% SC girls to SC enrolment<br />
% ST enrolment<br />
% ST girls to ST enrolment<br />
% OBC enrolment<br />
% OBC girls to OBC enr.<br />
Indicators<br />
% Girls<br />
Pupil-teacher ratio (PTR)<br />
Student-classroom ratio (SCR)<br />
% Schools with 100<br />
% Female teachers<br />
% Schools established since 1995<br />
Classrooms/Other rooms<br />
0.000 0.000<br />
% Muslim<br />
Primary level<br />
0.0 0.0<br />
0.000 0.000<br />
83.1 85.0 Enrolment<br />
0.93<br />
48.6 49.4<br />
% Muslim girls to<br />
0.0 0.0<br />
Flow rates<br />
0.005 0.000<br />
0.0 0.0 Muslim Enrolment<br />
Grade<br />
School category<br />
I<br />
P. only P + UP P+sec/hs U.P. only UP+Sec <strong>II</strong><br />
47.8 47.8 48.9 50.4 49.4 <strong>II</strong>I<br />
11 26 38 11 25 IV<br />
15 27 32 19 40 V<br />
21.6 4.5 0.0 30.8 0.0 I - V<br />
0.0 4.5 6.0 0.0 0.0 VI<br />
59.3 60.2 59.9 54.5 48.5 V<strong>II</strong><br />
14.9 47.0 20.9 43.6 0.0 V<strong>II</strong>I<br />
Classrooms<br />
School category<br />
Total<br />
classrooms<br />
% Good<br />
condition<br />
% Minor<br />
repairs<br />
% Major<br />
repairs<br />
Other<br />
rooms<br />
Primary only<br />
1,444 64.0 27.3 8.7 328<br />
Primary with Upper Primary<br />
706 62.2 24.1 13.7 209<br />
Primary with U.P. Sec/Hr. Sec. 1,156 79.2 18.5 2.3 309<br />
Upper Primary only<br />
248 66.9 28.6 4.4 78<br />
Upper Primary with Sec./H. Sec<br />
184 73.4 20.7 6.0 76<br />
Position of teachers by educational qualification (Other than Contractual-teachers)<br />
School category<br />
Below<br />
Secondary Higher<br />
Secondary<br />
Secondary Graduate<br />
Primary only<br />
138 387 897 474<br />
Primary with Upper Primary<br />
25 88 167 404<br />
Primary with U. P. Sec/ Hr. Sec.<br />
25 71 189 613<br />
Upper Primary only<br />
28 62 77 235<br />
Upper Primary with Sec./Higher Secondary 10 28 55 175<br />
Contractual-teachers<br />
Gender & caste distribution of teachers*<br />
School category Avg. No. of Tchs.<br />
Primary only<br />
8.8<br />
Primary with Upper Prim.<br />
11.3<br />
Prim.with U.P.Sec/Hr.Sec<br />
14.5<br />
Upper Primary only<br />
10.9<br />
U. Primary with Sec./Hr.S<br />
16.3<br />
Enrolment by medium of instructions*<br />
NER (Primary)<br />
GER(U.Prim)<br />
NER(U.Prim)<br />
R.R. D.O.R. P.R. Grade<br />
3.3<br />
I<br />
2.5<br />
<strong>II</strong><br />
3.0 1.9 95.1 <strong>II</strong>I<br />
1.9 15.2 82.9 IV<br />
2.9 6.2 90.9 V<br />
2.7 1.4 95.8 VI<br />
2.8<br />
V<strong>II</strong><br />
2.7 3.2 94.2 V<strong>II</strong>I<br />
2.9 # # Total<br />
155.0<br />
No. of schools by type of building*<br />
Post<br />
No<br />
Graduate M. Phil. Others response<br />
100.0<br />
112.0<br />
88.0<br />
100.0<br />
118.5<br />
96.7<br />
Enrolment<br />
All With disability<br />
Girls Boys Girls<br />
7,021 26 12<br />
6,787 19 14<br />
6,538 19 16<br />
5,839 17 14<br />
4,707 6 4<br />
4,363 5 6<br />
4,324 3 5<br />
3,885 3 2<br />
43,464 98 73<br />
Pucca<br />
Partially<br />
Multiple No<br />
Pucca Kuchcha Tent Type Building<br />
138 37 10 0 37 0<br />
30 15 5 0 16 0<br />
39 9 0 0 19 0<br />
23 9 1 0 6 0<br />
12 3 1 0 2 0<br />
26 2 4<br />
40 0 6 0<br />
70 0 5 0<br />
17 0 3 0<br />
21 0 0 0<br />
3 6 13 13 3 0 1 0<br />
Total<br />
Regular teachers Contractual-teachers SC teachers ST teachers<br />
Male Female No res Male Female No res Male Female Male Female<br />
1947 784 1144 0 9 10 0 18 17 749 1116<br />
743 291 439 0 5 8 0 25 22 117 280<br />
974 391 582 0 0 1 0 26 19 132 364<br />
424 192 230 0 1 1 0 11 3 162 215<br />
293 148 141 0 3 1 0 4 0 116 135<br />
% Total Primary Upper Primary % Schools recvd.<br />
Grossness<br />
(Previous year)<br />
14.6<br />
18.4<br />
School T L M<br />
dev. grant grant<br />
Examination results<br />
(Previous academic year)<br />
Terminal % % Passed<br />
0 grade Passed with >60%<br />
V boys 90.3 35.1<br />
V girls 89.7 39.3<br />
V<strong>II</strong>I boys 89.5 33.5<br />
V<strong>II</strong>I girls 89.0 34.1<br />
%Teachers recvd.<br />
In-service training<br />
Male Female<br />
0.0 0.0<br />
0.0 0.2<br />
0.0 0.0<br />
0.0 0.9<br />
0.0 0.0<br />
Incentives : Number of beneficiaries<br />
(Previous academic year)<br />
Category English Others<br />
Incentive<br />
P. only<br />
20832<br />
165<br />
90.1 88.3 Type<br />
P + UP<br />
18395<br />
559<br />
0.0 0.0 Text books<br />
P+sec/hs 34703<br />
1654<br />
0.0 0.0 Uniform<br />
U.P. only<br />
4636<br />
14<br />
76.9 76.9 Attendance<br />
UP+Sec<br />
7403<br />
0<br />
66.7 66.7 Stationery<br />
# = not applicable na = not available * Some totals may not match due to no response in classificatory data items<br />
Primary Upper primary<br />
Boys Girls Boys Girls<br />
11561 10234 2411 2409<br />
0 0 0 0<br />
0 0 0 0<br />
560 526 189 187<br />
395<br />
Nagaland


