

Volume II - DISE
Volume II - DISE
Volume II - DISE

Create successful ePaper yourself
Turn your PDF publications into a flip-book with our unique Google optimized e-Paper software.
Orissa<br />
414<br />
Elementary Education in India - Where do we stand <br />
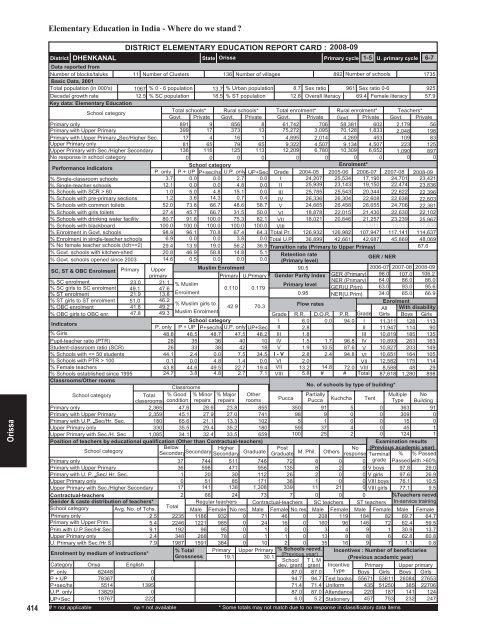
District<br />
DHENKANAL<br />
DISTRICT ELEMENTARY EDUCATION REPORT CARD : 2008-09<br />
State Orissa<br />
Primary cycle<br />
1-5 U. primary cycle 6-7<br />
Data reported from<br />
Number of blocks/taluks 11 Number of Clusters 136 Number of villages<br />
892 Number of schools<br />
1735<br />
Basic Data, 2001<br />
Total population (in 000's) 1067 % 0 - 6 population 13.7 % Urban population 8.7 Sex ratio 961 Sex ratio 0-6<br />
925<br />
Decadal growth rate<br />
12.5 % SC population 18.5 % ST population 12.8 Overall literacy 69.4 Female literacy 57.9<br />
Key data: Elementary Education<br />
School category<br />
Total schools* Rural schools* Total enrolment* Rural enrolment* Teachers*<br />
Govt. Private Govt. Private Govt. Private Govt. Private Govt. Private<br />
Primary only<br />
891 9 856 8 61,742 706 58,381 602 2,179 56<br />
Primary with Upper Primary<br />
399 17 373 13 75,272 3,095 70,128 1,833 2,048 198<br />
Primary with Upper Primary Sec/Higher Sec. 17 4 16 1 4,895 2,014 4,269 453 109 83<br />
Upper Primary only<br />
81 65 79 65 9,322 4,507 9,134 4,507 223 125<br />
Upper Primary with Sec./Higher Secondary 136 116 125 113 12,209 6,780 10,309 6,652 1,090 897<br />
No response in school category<br />
0 0 0 0 0 0 0 0 0 0<br />
Performance indicators<br />
School category<br />
Enrolment*<br />
P. only P + UP P+sec/hs U.P. only UP+Sec Grade 2004-05 2005-06 2006-07 2007-08 2008-09<br />
% Single-classroom schools<br />
3.7 0.0 0.0 2.7 0.0 I 24,207 25,534 17,190 24,701 23,421<br />
% Single-teacher schools<br />
12.1 0.0 0.0 4.8 0.0 <strong>II</strong> 25,939 23,143 19,150 22,474 23,836<br />
% Schools with SCR > 60<br />
1.0 5.0 4.8 15.1 0.0 <strong>II</strong>I 25,785 25,543 20,344 22,622 22,396<br />
% Schools with pre-primary sections 1.2 3.6 14.3 0.7 0.4 IV 26,336 26,304 22,608 22,638 22,603<br />
% Schools with common toilets 52.0 73.8 66.7 48.6 58.7 V 24,665 26,458 28,655 24,706 22,381<br />
% Schools with girls toilets 27.4 45.7 66.7 31.5 50.0 VI 18,878 22,015 21,430 22,630 22,102<br />
% Schools with drinking water facility 80.7 91.8 100.0 75.3 82.1 V<strong>II</strong> 18,021 20,646 21,257 23,239 25,967<br />
% Schools with blackboard<br />
100.0 100.0 100.0 100.0 100.0 V<strong>II</strong>I<br />
1,911 19,031 17,836<br />
% Enrolment in Govt. schools 98.9 96.1 70.8 67.4 64.3 Total Pr. 126,932 126,982 107,947 117,141 114,637<br />
% Enrolment in single-teacher schools 6.9 0.0 0.0 3.8 0.0 Total U.P 36,899 42,661 42,687 45,869 48,069<br />
% No female teacher schools (tch>=2) 29.4 13.9 19.0 56.2 36.9 Transition rate (Primary to Upper Primay)<br />
87.6<br />
% Govt. schools with kitchen-shed 20.8 46.9 58.8 14.8 5.1 Retention rate<br />
% Govt. schools opened since 2003 14.6 0.5 0.0 0.0 0.0 (Primary level)<br />
/ NER<br />
GER<br />
SC, ST & OBC Enrolment Primary Upper<br />
Muslim Enrolment<br />
90.5<br />
2006-07 2007-08 2008-09<br />
primary<br />
Primary U.Primary Gender Parity Index GER (Primary) 96.0 107.0 106.2<br />
% SC enrolment<br />
% SC girls to SC enrolment<br />
% ST enrolment<br />
% ST girls to ST enrolment<br />
% OBC enrolment<br />
% OBC girls to OBC enr.<br />
Indicators<br />
% Girls<br />
Pupil-teacher ratio (PTR)<br />
Student-classroom ratio (SCR)<br />
% Schools with 100<br />
% Female teachers<br />
% Schools established since 1995<br />
Classrooms/Other rooms<br />
23.0 21.1<br />
NER (Primary)<br />
% Muslim<br />
Primary level<br />
49.1 47.6<br />
0.110 0.179<br />
GER(U.Prim)<br />
21.9 13.8 Enrolment<br />
0.95 NER(U.Prim)<br />
51.0 46.2<br />
% Muslim girls to<br />
42.9 70.3<br />
Flow rates<br />
41.8 49.2<br />
47.8 49.3 Muslim Enrolment<br />
Grade R.R. D.O.R. P.R. Grade<br />
School category<br />
I 6.0 0.0 94.0 I<br />
P. only P + UP P+sec/hs U.P. only UP+Sec <strong>II</strong> 2.8<br />
<strong>II</strong><br />
48.8 48.5 48.7 47.5 48.2 <strong>II</strong>I 1.8<br />
<strong>II</strong>I<br />
28 35 36 40 10 IV 1.5 1.7 96.8 IV<br />
26 33 38 42 18 V 1.9 10.5 87.6 V<br />
44.1 2.4 0.0 7.5 34.5 I - V 2.8 2.4 94.8 VI<br />
0.1 0.0 4.8 1.4 0.0 VI 2.0<br />
V<strong>II</strong><br />
43.8 44.6 49.5 22.7 19.4 V<strong>II</strong> 13.2 14.8 72.0 V<strong>II</strong>I<br />
24.7 3.8 4.8 2.7 7.1 V<strong>II</strong>I 5.8 # # Total<br />
Classrooms<br />
School category<br />
Total<br />
classrooms<br />
% Good<br />
condition<br />
% Minor<br />
repairs<br />
% Major<br />
repairs<br />
Other<br />
rooms<br />
Primary only<br />
2,365 47.6 28.6 23.8 855<br />
Primary with Upper Primary<br />
2,359 45.1 27.9 27.0 741<br />
Primary with U.P. Sec/Hr. Sec.<br />
180 65.6 21.1 13.3 102<br />
Upper Primary only<br />
330 35.5 29.4 35.2 180<br />
Upper Primary with Sec./H. Sec 1,085 34.1 32.4 33.5 659<br />
Position of teachers by educational qualification (Other than Contractual-teachers)<br />
School category<br />
Below<br />
Secondary Higher<br />
Secondary<br />
Secondary Graduate<br />
Primary only<br />
37 744 511 746<br />
Primary with Upper Primary<br />
36 598 471 956<br />
Primary with U. P. Sec/ Hr. Sec.<br />
1 20 30 112<br />
Upper Primary only<br />
0 51 85 171<br />
Upper Primary with Sec./Higher Secondary 17 141 138 1,308<br />
Contractual-teachers<br />
Gender & caste distribution of teachers*<br />
School category Avg. No. of Tchs.<br />
Primary only<br />
2.5<br />
Primary with Upper Prim.<br />
5.4<br />
Prim.with U.P.Sec/Hr.Sec<br />
9.1<br />
Upper Primary only<br />
2.4<br />
U. Primary with Sec./Hr.S<br />
7.9<br />
Enrolment by medium of instructions*<br />
64.0<br />
63.0<br />
34.0<br />
No. of schools by type of building*<br />
Post<br />
No<br />
Graduate M. Phil. Others response<br />
86.0<br />
93.0<br />
65.0<br />
86.0<br />
95.6<br />
66.9<br />
Enrolment<br />
All With disability<br />
Girls Boys Girls<br />
11,311 128 113<br />
11,947 114 90<br />
10,819 185 135<br />
10,893 263 163<br />
10,827 203 149<br />
10,651 164 105<br />
12,582 175 114<br />
8,588 48 29<br />
87,618 1,280 898<br />
Pucca<br />
Partially<br />
Multiple No<br />
Pucca Kuchcha Tent Type Building<br />
350 91 5 0 363 91<br />
98 9 0 0 309 0<br />
5 1 0 0 15 0<br />
59 37 4 0 45 1<br />
100 25 2 0 124 1<br />
72 8 0<br />
135 8 2 0<br />
26 2 0 0<br />
38 1 0 0<br />
339 11 21 0<br />
2 66 24 73 7 0 0 0<br />
Total<br />
Regular teachers Contractual-teachers SC teachers ST teachers<br />
Male Female No res Male Female No res Male Female Male Female<br />
2235 1186 932 0 71 46 0 208 119 184 82<br />
2246 1221 985 0 24 16 0 160 96 146 72<br />
192 96 95 0 1 0 0 3 4 9 1<br />
348 268 78 0 1 1 0 13 8 8 6<br />
1987 1591 384 0 10 2 0 35 16 9 7<br />
% Total Primary Upper Primary % Schools recvd.<br />
Grossness<br />
(Previous year)<br />
19.1<br />
30.1<br />
School T L M<br />
dev. grant grant<br />
Examination results<br />
(Previous academic year)<br />
Terminal % % Passed<br />
0 grade Passed with >60%<br />
V boys 97.8 29.0<br />
V girls 97.6 26.9<br />
V<strong>II</strong>I boys 76.1 10.5<br />
V<strong>II</strong>I girls 77.1 9.5<br />
%Teachers recvd.<br />
In-service training<br />
Male Female<br />
69.7 64.7<br />
62.4 59.5<br />
30.9 13.7<br />
62.8 60.8<br />
1.1 0.8<br />
Incentives : Number of beneficiaries<br />
(Previous academic year)<br />
Category Oriya English<br />
Incentive<br />
P. only<br />
62448<br />
0<br />
87.0 87.0 Type<br />
P + UP<br />
78367<br />
0<br />
94.7 94.7 Text books<br />
P+sec/hs<br />
5514<br />
1395<br />
71.4 71.4 Uniform<br />
U.P. only 13829<br />
0<br />
87.0 87.0 Attendance<br />
UP+Sec<br />
18767<br />
222<br />
6.0 5.2 Stationery<br />
# = not applicable na = not available * Some totals may not match due to no response in classificatory data items<br />
Primary Upper primary<br />
Boys Girls Boys Girls<br />
55671 53811 26084 27653<br />
435 51250 385 22706<br />
220 187 141 124<br />
457 753 232 247


