

Volume II - DISE
Volume II - DISE
Volume II - DISE

Create successful ePaper yourself
Turn your PDF publications into a flip-book with our unique Google optimized e-Paper software.
West Bengal<br />
630<br />
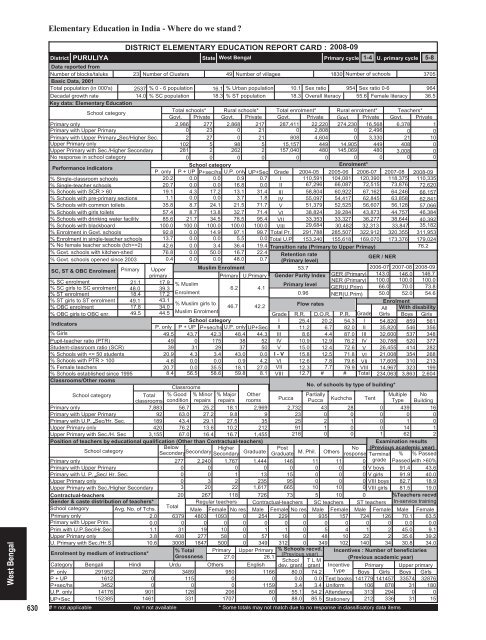
Elementary Education in India - Where do we stand <br />
District<br />
PURULIYA<br />
DISTRICT ELEMENTARY EDUCATION REPORT CARD : 2008-09<br />
State West Bengal<br />
Primary cycle<br />
1-4 U. primary cycle 5-8<br />
Data reported from<br />
Number of blocks/taluks 23 Number of Clusters 49 Number of villages<br />
1830 Number of schools<br />
3705<br />
Basic Data, 2001<br />
Total population (in 000's) 2537 % 0 - 6 population 16.1 % Urban population 10.1 Sex ratio 954 Sex ratio 0-6<br />
964<br />
Decadal growth rate<br />
14.0 % SC population 18.3 % ST population 18.3 Overall literacy 55.6 Female literacy 36.5<br />
Key data: Elementary Education<br />
School category<br />
Total schools* Rural schools* Total enrolment* Rural enrolment* Teachers*<br />
Govt. Private Govt. Private Govt. Private Govt. Private Govt. Private<br />
Primary only<br />
2,986 277 2,868 217 287,411 22,220 274,230 16,568 6,378 1<br />
Primary with Upper Primary<br />
0 23 0 21 0 2,808 0 2,496 0 0<br />
Primary with Upper Primary Sec/Higher Sec.<br />
2 27 0 21 808 4,604 0 3,330 21 10<br />
Upper Primary only<br />
102 5 98 5 15,157 449 14,905 449 408 0<br />
Upper Primary with Sec./Higher Secondary 281 2 262 2 157,040 480 145,069 480 3,008 0<br />
No response in school category<br />
0 0 0 0 0 0 0 0 0 0<br />
Performance indicators<br />
School category<br />
Enrolment*<br />
P. only P + UP P+sec/hs U.P. only UP+Sec Grade 2004-05 2005-06 2006-07 2007-08 2008-09<br />
% Single-classroom schools<br />
20.2 0.0 0.0 0.9 0.7 I 110,591 104,081 120,390 118,375 110,335<br />
% Single-teacher schools<br />
20.7 0.0 0.0 16.8 0.0 <strong>II</strong> 67,296 66,087 72,515 73,876 72,620<br />
% Schools with SCR > 60<br />
19.1 4.3 17.2 13.1 31.4 <strong>II</strong>I 58,804 60,922 67,162 64,246 66,157<br />
% Schools with pre-primary sections 1.1 0.0 0.0 3.7 1.8 IV 55,097 54,417 62,845 63,858 62,841<br />
% Schools with common toilets 35.8 8.7 24.1 21.5 71.7 V 51,379 52,525 56,607 56,128 57,066<br />
% Schools with girls toilets 57.4 8.7 13.8 32.7 71.4 VI 38,824 39,284 43,873 44,757 46,384<br />
% Schools with drinking water facility 85.6 21.7 34.5 78.5 95.4 V<strong>II</strong> 33,353 33,327 36,277 38,644 40,392<br />
% Schools with blackboard<br />
100.0 100.0 100.0 100.0 100.0 V<strong>II</strong>I 29,684 30,482 32,313 33,847 35,182<br />
% Enrolment in Govt. schools 92.8 0.0 14.9 97.1 99.7 Total Pr. 291,788 285,507 322,912 320,355 311,953<br />
% Enrolment in single-teacher schools 13.7 0.0 0.0 5.5 0.0 Total U.P 153,240 155,618 169,070 173,376 179,024<br />
% No female teacher schools (tch>=2) 42.6 0.0 3.4 36.4 19.4 Transition rate (Primary to Upper Primay)<br />
76.2<br />
% Govt. schools with kitchen-shed 76.8 0.0 50.0 16.7 22.4 Retention rate<br />
% Govt. schools opened since 2003 0.4 0.0 0.0 48.0 0.7 (Primary level)<br />
/ NER<br />
GER<br />
SC, ST & OBC Enrolment Primary Upper<br />
Muslim Enrolment<br />
53.7<br />
2006-07 2007-08 2008-09<br />
primary<br />
Primary U.Primary Gender Parity Index GER (Primary) 143.0 146.0 146.7<br />
% SC enrolment<br />
% SC girls to SC enrolment<br />
% ST enrolment<br />
% ST girls to ST enrolment<br />
% OBC enrolment<br />
% OBC girls to OBC enr.<br />
Indicators<br />
% Girls<br />
Pupil-teacher ratio (PTR)<br />
Student-classroom ratio (SCR)<br />
% Schools with 100<br />
% Female teachers<br />
% Schools established since 1995<br />
Classrooms/Other rooms<br />
21.1 17.9 % Muslim<br />
Primary level<br />
48.0 39.3<br />
6.2 4.1<br />
18.4 17.2 Enrolment<br />
0.96<br />
49.1 43.1<br />
% Muslim girls to<br />
46.7 42.2<br />
Flow rates<br />
17.8 34.0<br />
49.5 44.5 Muslim Enrolment<br />
Grade<br />
School category<br />
I<br />
P. only P + UP P+sec/hs U.P. only UP+Sec <strong>II</strong><br />
49.5 43.7 42.3 48.4 44.3 <strong>II</strong>I<br />
49 0 175 38 52 IV<br />
39 31 29 37 50 V 15.0<br />
20.9 4.3 3.4 43.0 0.0 I - V 15.8<br />
4.6 0.0 0.0 0.9 4.2 VI 12.6<br />
20.7 0.0 35.5 18.1 27.0 V<strong>II</strong> 12.3<br />
8.4 56.5 58.6 59.8 8.1 V<strong>II</strong>I 12.7<br />
Classrooms<br />
School category<br />
Total<br />
classrooms<br />
% Good<br />
condition<br />
% Minor<br />
repairs<br />
% Major<br />
repairs<br />
Other<br />
rooms<br />
Primary only<br />
7,883 56.7 25.2 18.1 2,969<br />
Primary with Upper Primary<br />
92 63.0 27.2 9.8<br />
9<br />
Primary with U.P. Sec/Hr. Sec.<br />
189 43.4 29.1 27.5 35<br />
Upper Primary only<br />
420 76.2 13.6 10.2 212<br />
Upper Primary with Sec./H. Sec 3,155 67.0 16.4 16.7 1,455<br />
Position of teachers by educational qualification (Other than Contractual-teachers)<br />
School category<br />
Below<br />
Secondary Higher<br />
Secondary<br />
Secondary Graduate<br />
Primary only<br />
277 2,240 1,767 1,444<br />
Primary with Upper Primary<br />
0 0 0 0<br />
Primary with U. P. Sec/ Hr. Sec.<br />
0 0 1 13<br />
Upper Primary only<br />
0 3 2 235<br />
Upper Primary with Sec./Higher Secondary<br />
3 20 22 1,617<br />
Contractual-teachers<br />
Gender & caste distribution of teachers*<br />
School category Avg. No. of Tchs.<br />
Primary only<br />
2.0<br />
Primary with Upper Prim.<br />
0.0<br />
Prim.with U.P.Sec/Hr.Sec<br />
1.1<br />
Upper Primary only<br />
3.8<br />
U. Primary with Sec./Hr.S<br />
10.6<br />
Enrolment by medium of instructions*<br />
NER (Primary)<br />
GER(U.Prim)<br />
NER(U.Prim)<br />
Grade<br />
20.2 54.3 I<br />
6.7 82.0 <strong>II</strong><br />
4.4 87.0 <strong>II</strong>I<br />
12.9 76.2 IV<br />
12.4 72.6 V<br />
12.5 71.8 VI<br />
7.8 79.6 V<strong>II</strong><br />
7.7 79.9 V<strong>II</strong>I<br />
# # Total<br />
R.R. D.O.R. P.R.<br />
25.4<br />
11.2<br />
8.6<br />
10.9<br />
100.0<br />
66.0<br />
50.0<br />
No. of schools by type of building*<br />
Post<br />
No<br />
Graduate M. Phil. Others response<br />
100.0<br />
70.0<br />
52.0<br />
100.0<br />
73.8<br />
54.6<br />
Enrolment<br />
All With disability<br />
Girls Boys Girls<br />
54,820 859 561<br />
35,820 546 356<br />
32,600 537 348<br />
30,788 520 377<br />
26,455 414 282<br />
21,008 354 268<br />
17,605 310 213<br />
14,967 323 199<br />
234,063 3,863 2,604<br />
Pucca<br />
Partially<br />
Multiple No<br />
Pucca Kuchcha Tent Type Building<br />
2,732 43 28 0 439 16<br />
23 0 0 0 0 0<br />
25 2 1 0 1 0<br />
91 1 0 0 14 1<br />
218 0 0 1 62 2<br />
146 11 11<br />
0 0 0 0<br />
15 0 0 0<br />
95 0 0 0<br />
665 10 10 0<br />
20 267 118 726 73 5 10 0<br />
Total<br />
Regular teachers Contractual-teachers SC teachers ST teachers<br />
Male Female No res Male Female No res Male Female Male Female<br />
6379 4803 1093 0 254 229 0 935 157 724 126<br />
0 0 0 0 0 0 0 0 0 0 0<br />
31 19 10 0 1 1 0 5 4 1 2<br />
408 277 58 0 57 16 0 48 10 22 2<br />
3008 1847 500 0 349 312 0 349 102 140 34<br />
% Total Primary Upper Primary % Schools recvd.<br />
Grossness<br />
(Previous year)<br />
27.0<br />
26.1<br />
School T L M<br />
Urdu Others<br />
dev. grant grant<br />
Examination results<br />
(Previous academic year)<br />
Terminal % % Passed<br />
0 grade Passed with >60%<br />
V boys 91.4 43.6<br />
V girls 91.9 40.0<br />
V<strong>II</strong>I boys 82.7 18.9<br />
V<strong>II</strong>I girls 81.5 19.0<br />
%Teachers recvd.<br />
In-service training<br />
Male Female<br />
70.1 63.5<br />
0.0 0.0<br />
45.0 9.1<br />
35.6 39.2<br />
30.8 34.0<br />
Incentives : Number of beneficiaries<br />
(Previous academic year)<br />
Category Bengali Hindi<br />
English<br />
Incentive<br />
P. only<br />
291952<br />
2679<br />
3489<br />
950<br />
1166 80.0 74.2 Type<br />
P + UP<br />
1612<br />
0<br />
115<br />
0<br />
0 0.0 0.0 Text books<br />
P+sec/hs<br />
3452<br />
0<br />
0<br />
0<br />
1159 3.4 3.4 Uniform<br />
U.P. only 14176<br />
901<br />
128<br />
206<br />
80 55.1 54.2 Attendance<br />
UP+Sec 152385<br />
1461<br />
331<br />
1707<br />
0 88.0 85.5 Stationery<br />
# = not applicable na = not available * Some totals may not match due to no response in classificatory data items<br />
Primary Upper primary<br />
Boys Girls Boys Girls<br />
141779 141457 33574 32876<br />
106 878 31 180<br />
313 294 0 0<br />
212 336 31 15


