

Volume II - DISE
Volume II - DISE
Volume II - DISE

You also want an ePaper? Increase the reach of your titles
YUMPU automatically turns print PDFs into web optimized ePapers that Google loves.
District<br />
TARAN TARAN<br />
State Punjab<br />
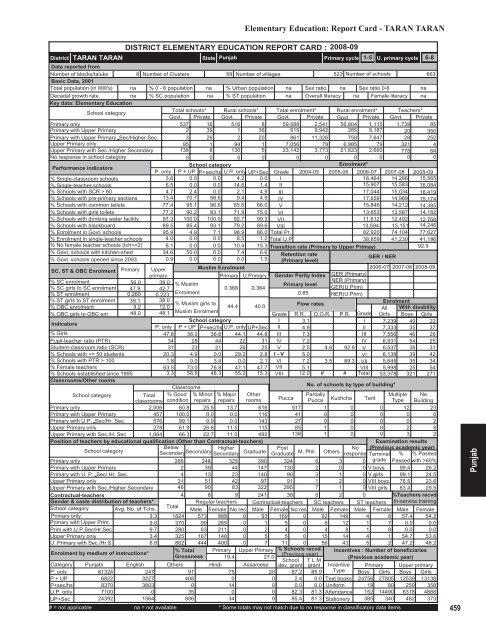
Elementary Education: Report Card - TARAN TARAN<br />
DISTRICT ELEMENTARY EDUCATION REPORT CARD : 2008-09<br />
Primary cycle<br />
1-5 U. primary cycle 6-8<br />
Data reported from<br />
Number of blocks/taluks<br />
8 Number of Clusters 59 Number of villages<br />
523 Number of schools<br />
863<br />
Basic Data, 2001<br />
Total population (in 000's) na % 0 - 6 population na % Urban population na Sex ratio na Sex ratio 0-6<br />
na<br />
Decadal growth rate<br />
na % SC population na % ST population na Overall literacy na Female literacy na<br />
Key data: Elementary Education<br />
School category<br />
Total schools* Rural schools* Total enrolment* Rural enrolment* Teachers*<br />
Govt. Private Govt. Private Govt. Private Govt. Private Govt. Private<br />
Primary only<br />
537 16 516 8 59,588 2,541 56,804 1,115 1,739 85<br />
Primary with Upper Primary<br />
2 39 1 36 515 9,942 285 9,187 20 350<br />
Primary with Upper Primary Sec/Higher Sec.<br />
3 26 2 20 861 11,326 758 7,647 28 252<br />
Upper Primary only<br />
95 1 94 1 7,056 79 6,985 79 321 4<br />
Upper Primary with Sec./Higher Secondary 136 8 130 5 23,142 3,773 21,623 2,660 778 84<br />
No response in school category<br />
0 0 0 0 0 0 0 0 0 0<br />
Performance indicators<br />
School category<br />
Enrolment*<br />
P. only P + UP P+sec/hs U.P. only UP+Sec Grade 2004-05 2005-06 2006-07 2007-08 2008-09<br />
% Single-classroom schools<br />
3.6 0.0 0.0 4.2 0.0 I<br />
16,464 14,286 15,565<br />
% Single-teacher schools<br />
6.5 0.0 0.0 14.6 1.4 <strong>II</strong><br />
15,907 15,583 16,084<br />
% Schools with SCR > 60<br />
4.7 2.4 0.0 2.1 4.9 <strong>II</strong>I<br />
17,044 15,034 16,419<br />
% Schools with pre-primary sections 13.4 70.7 58.6 9.4 4.9 IV<br />
17,659 14,989 15,174<br />
% Schools with common toilets 77.4 95.1 96.6 65.6 66.0 V<br />
15,846 14,212 14,385<br />
% Schools with girls toilets 77.2 90.2 93.1 71.9 75.0 VI<br />
13,653 13,587 14,182<br />
% Schools with drinking water facility 97.3 100.0 100.0 92.7 99.3 V<strong>II</strong><br />
11,612 12,492 12,768<br />
% Schools with blackboard<br />
89.5 85.4 93.1 79.2 89.6 V<strong>II</strong>I<br />
13,594 15,151 14,246<br />
% Enrolment in Govt. schools 95.9 4.9 7.1 98.9 86.0 Total Pr. 82,920 74,104 77,627<br />
% Enrolment in single-teacher schools 4.0 0.0 0.0 8.5 1.2 Total U.P<br />
38,859 41,230 41,196<br />
% No female teacher schools (tch>=2) 8.1 0.0 0.0 10.4 15.3 Transition rate (Primary to Upper Primay)<br />
92.9<br />
% Govt. schools with kitchen-shed 34.6 50.0 0.0 7.4 6.6 Retention rate<br />
% Govt. schools opened since 2003 0.9 0.0 0.0 0.0 1.5 (Primary level)<br />
/ NER<br />
GER<br />
SC, ST & OBC Enrolment Primary Upper<br />
Muslim Enrolment<br />
2006-07 2007-08 2008-09<br />
primary<br />
Primary U.Primary Gender Parity Index GER (Primary)<br />
% SC enrolment<br />
% SC girls to SC enrolment<br />
% ST enrolment<br />
% ST girls to ST enrolment<br />
% OBC enrolment<br />
% OBC girls to OBC enr.<br />
Indicators<br />
% Girls<br />
Pupil-teacher ratio (PTR)<br />
Student-classroom ratio (SCR)<br />
% Schools with 100<br />
% Female teachers<br />
% Schools established since 1995<br />
Classrooms/Other rooms<br />
56.0 39.0<br />
NER (Primary)<br />
% Muslim<br />
Primary level<br />
47.9 42.7<br />
0.368 0.364<br />
GER(U.Prim)<br />
0.260 0.223<br />
Enrolment<br />
0.85 NER(U.Prim)<br />
39.1 38.0<br />
% Muslim girls to<br />
44.4 40.0<br />
Flow rates<br />
9.2 12.0<br />
48.0 48.1 Muslim Enrolment<br />
Grade R.R. D.O.R. P.R. Grade<br />
School category<br />
I 3.1<br />
I<br />
P. only P + UP P+sec/hs U.P. only UP+Sec <strong>II</strong> 4.9<br />
<strong>II</strong><br />
47.8 38.0 36.8 44.1 44.8 <strong>II</strong>I 7.3<br />
<strong>II</strong>I<br />
34 28 44 22 31 IV 7.2<br />
IV<br />
31 23 21 26 25 V 2.5 4.6 92.9 V<br />
20.3 4.9 0.0 29.2 2.8 I - V 5.0<br />
VI<br />
1.8 0.0 3.4 0.0 2.1 VI 7.2 3.5 89.3 V<strong>II</strong><br />
63.5 73.0 76.8 47.1 47.7 V<strong>II</strong> 5.1<br />
V<strong>II</strong>I<br />
3.3 58.5 48.3 55.2 15.3 V<strong>II</strong>I 12.0 # # Total<br />
Classrooms<br />
School category<br />
Total<br />
classrooms<br />
% Good<br />
condition<br />
% Minor<br />
repairs<br />
% Major<br />
repairs<br />
Other<br />
rooms<br />
Primary only<br />
2,006 60.8 25.5 13.7 616<br />
Primary with Upper Primary<br />
457 100.0 0.0 0.0 116<br />
Primary with U.P. Sec/Hr. Sec.<br />
576 99.1 0.9 0.0 143<br />
Upper Primary only<br />
278 61.9 26.6 11.5 115<br />
Upper Primary with Sec./H. Sec 1,064 66.3 22.7 11.0 492<br />
Position of teachers by educational qualification (Other than Contractual-teachers)<br />
School category<br />
Below<br />
Secondary Higher<br />
Secondary<br />
Secondary Graduate<br />
Primary only<br />
266 248 325 390<br />
Primary with Upper Primary<br />
2 39 44 147<br />
Primary with U. P. Sec/ Hr. Sec.<br />
4 13 23 140<br />
Upper Primary only<br />
31 51 42 97<br />
Upper Primary with Sec./Higher Secondary 46 90 83 322<br />
Contractual-teachers<br />
Gender & caste distribution of teachers*<br />
School category Avg. No. of Tchs.<br />
Primary only<br />
3.3<br />
Primary with Upper Prim.<br />
9.0<br />
Prim.with U.P.Sec/Hr.Sec<br />
9.7<br />
Upper Primary only<br />
3.4<br />
U. Primary with Sec./Hr.S<br />
6.0<br />
Enrolment by medium of instructions*<br />
No. of schools by type of building*<br />
Post<br />
No<br />
Graduate M. Phil. Others response<br />
Enrolment<br />
All With disability<br />
Girls Boys Girls<br />
7,239 49 22<br />
7,333 35 37<br />
7,556 46 26<br />
6,931 54 25<br />
6,537 38 31<br />
6,139 39 42<br />
5,645 35 34<br />
5,998 25 54<br />
53,378 321 271<br />
Pucca<br />
Partially<br />
Multiple No<br />
Pucca Kuchcha Tent Type Building<br />
517 1 0 0 12 23<br />
41 0 0 0 0 0<br />
27 0 0 0 0 2<br />
85 1 0 0 2 8<br />
138 1 0 0 3 2<br />
324 6 3<br />
130 2 0 0<br />
90 3 1 0<br />
91 1 2 0<br />
295 7 1 0<br />
4 8 9 241 38 0 2 0<br />
Total<br />
Regular teachers Contractual-teachers SC teachers ST teachers<br />
Male Female No res Male Female No res Male Female Male Female<br />
1824 573 989 0 93 169 0 92 149 4 8<br />
370 99 265 0 1 5 0 6 12 1 7<br />
280 63 211 0 2 4 0 4 8 1 8<br />
325 167 148 0 5 5 0 15 14 4 1<br />
862 444 400 0 7 11 0 56 43 5 2<br />
% Total Primary Upper Primary % Schools recvd.<br />
Grossness<br />
(Previous year)<br />
19.4<br />
27.0<br />
School T L M<br />
Others Hindi<br />
dev. grant grant<br />
Examination results<br />
(Previous academic year)<br />
Terminal % % Passed<br />
0 grade Passed with >60%<br />
V boys 99.4 26.2<br />
V girls 99.1 24.5<br />
V<strong>II</strong>I boys 78.5 23.6<br />
V<strong>II</strong>I girls 83.4 29.5<br />
%Teachers recvd.<br />
In-service training<br />
Male Female<br />
57.4 54.2<br />
0.0 0.0<br />
0.0 0.0<br />
54.7 53.6<br />
47.2 48.2<br />
Incentives : Number of beneficiaries<br />
(Previous academic year)<br />
Category Punjabi English<br />
Assamese<br />
Incentive<br />
P. only<br />
61324<br />
247<br />
91<br />
75<br />
20 87.2 85.9 Type<br />
P + UP<br />
6822<br />
3227<br />
408<br />
0<br />
0 2.4 0.0 Text books<br />
P+sec/hs<br />
8370<br />
3803<br />
0<br />
14<br />
0 0.0 0.0 Uniform<br />
U.P. only<br />
7100<br />
0<br />
35<br />
0<br />
0 82.3 81.3 Attendance<br />
UP+Sec<br />
24392<br />
1564<br />
806<br />
34<br />
0 85.4 81.3 Stationery<br />
# = not applicable na = not available * Some totals may not match due to no response in classificatory data items<br />
Primary Upper primary<br />
Boys Girls Boys Girls<br />
24756 27805 12539 13138<br />
19 80 250 358<br />
152 14490 6318 4888<br />
385 340 482 373<br />
459<br />
Punjab


