

Volume II - DISE
Volume II - DISE
Volume II - DISE

Create successful ePaper yourself
Turn your PDF publications into a flip-book with our unique Google optimized e-Paper software.
District<br />
PEREN<br />
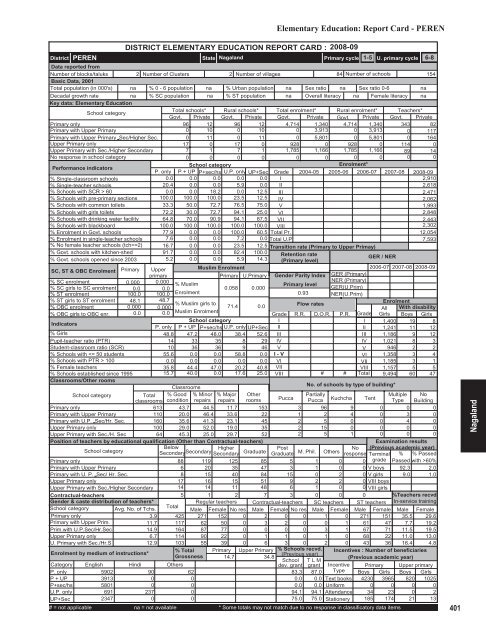
DISTRICT ELEMENTARY EDUCATION REPORT CARD : 2008-09<br />
State Nagaland<br />
Elementary Education: Report Card - PEREN<br />
Primary cycle<br />
1-5 U. primary cycle 6-8<br />
Data reported from<br />
Number of blocks/taluks<br />
2 Number of Clusters 2 Number of villages<br />
84 Number of schools<br />
154<br />
Basic Data, 2001<br />
Total population (in 000's) na % 0 - 6 population na % Urban population na Sex ratio na Sex ratio 0-6<br />
na<br />
Decadal growth rate<br />
na % SC population na % ST population na Overall literacy na Female literacy na<br />
Key data: Elementary Education<br />
School category<br />
Total schools* Rural schools* Total enrolment* Rural enrolment* Teachers*<br />
Govt. Private Govt. Private Govt. Private Govt. Private Govt. Private<br />
Primary only<br />
96 12 96 12 4,714 1,340 4,714 1,340 343 82<br />
Primary with Upper Primary<br />
0 10 0 10 0 3,913 0 3,913 0 117<br />
Primary with Upper Primary Sec/Higher Sec.<br />
0 11 0 11 0 5,801 0 5,801 0 164<br />
Upper Primary only<br />
17 0 17 0 928 0 928 0 114 0<br />
Upper Primary with Sec./Higher Secondary<br />
7 1 7 1 1,785 1,166 1,785 1,166 89 14<br />
No response in school category<br />
0 0 0 0 0 0 0 0 0 0<br />
Performance indicators<br />
School category<br />
Enrolment*<br />
P. only P + UP P+sec/hs U.P. only UP+Sec Grade 2004-05 2005-06 2006-07 2007-08 2008-09<br />
% Single-classroom schools<br />
0.0 0.0 0.0 0.0 0.0 I<br />
2,910<br />
% Single-teacher schools<br />
20.4 0.0 0.0 5.9 0.0 <strong>II</strong><br />
2,618<br />
% Schools with SCR > 60<br />
0.0 0.0 18.2 0.0 12.5 <strong>II</strong>I<br />
2,471<br />
% Schools with pre-primary sections 100.0 100.0 100.0 23.5 12.5 IV<br />
2,062<br />
% Schools with common toilets 33.3 50.0 72.7 76.5 75.0 V<br />
1,993<br />
% Schools with girls toilets 72.2 30.0 72.7 94.1 25.0 VI<br />
2,848<br />
% Schools with drinking water facility 64.8 70.0 90.9 94.1 87.5 V<strong>II</strong><br />
2,443<br />
% Schools with blackboard<br />
100.0 100.0 100.0 100.0 100.0 V<strong>II</strong>I<br />
2,302<br />
% Enrolment in Govt. schools 77.9 0.0 0.0 100.0 60.5 Total Pr. 12,054<br />
% Enrolment in single-teacher schools 7.6 0.0 0.0 7.2 0.0 Total U.P<br />
7,593<br />
% No female teacher schools (tch>=2) 16.7 0.0 0.0 23.5 12.5 Transition rate (Primary to Upper Primay)<br />
% Govt. schools with kitchen-shed 91.7 0.0 0.0 82.4 100.0 Retention rate<br />
% Govt. schools opened since 2003 5.2 0.0 0.0 5.9 14.3 (Primary level)<br />
/ NER<br />
GER<br />
SC, ST & OBC Enrolment Primary Upper<br />
Muslim Enrolment<br />
2006-07 2007-08 2008-09<br />
primary<br />
Primary U.Primary Gender Parity Index GER (Primary)<br />
% SC enrolment<br />
% SC girls to SC enrolment<br />
% ST enrolment<br />
% ST girls to ST enrolment<br />
% OBC enrolment<br />
% OBC girls to OBC enr.<br />
Indicators<br />
% Girls<br />
Pupil-teacher ratio (PTR)<br />
Student-classroom ratio (SCR)<br />
% Schools with 100<br />
% Female teachers<br />
% Schools established since 1995<br />
Classrooms/Other rooms<br />
0.000 0.000<br />
NER (Primary)<br />
% Muslim<br />
Primary level<br />
0.0 0.0<br />
0.058 0.000<br />
GER(U.Prim)<br />
100.0 100.0 Enrolment<br />
0.93 NER(U.Prim)<br />
48.1 48.7<br />
% Muslim girls to<br />
71.4 0.0<br />
Flow rates<br />
0.000 0.000<br />
0.0 0.0 Muslim Enrolment<br />
Grade R.R. D.O.R. P.R. Grade<br />
School category<br />
I<br />
I<br />
P. only P + UP P+sec/hs U.P. only UP+Sec <strong>II</strong><br />
<strong>II</strong><br />
48.8 47.2 48.0 38.4 52.6 <strong>II</strong>I<br />
<strong>II</strong>I<br />
14 33 35 8 29 IV<br />
IV<br />
10 36 36 9 46 V<br />
V<br />
55.6 0.0 0.0 58.8 0.0 I - V<br />
VI<br />
0.0 0.0 0.0 0.0 0.0 VI<br />
V<strong>II</strong><br />
35.8 44.4 47.0 20.2 40.8 V<strong>II</strong><br />
V<strong>II</strong>I<br />
15.7 40.0 0.0 17.6 25.0 V<strong>II</strong>I<br />
# # Total<br />
Classrooms<br />
School category<br />
Total<br />
classrooms<br />
% Good<br />
condition<br />
% Minor<br />
repairs<br />
% Major<br />
repairs<br />
Other<br />
rooms<br />
Primary only<br />
613 43.7 44.5 11.7 153<br />
Primary with Upper Primary<br />
110 20.0 46.4 33.6 22<br />
Primary with U.P. Sec/Hr. Sec.<br />
160 35.6 41.3 23.1 45<br />
Upper Primary only<br />
100 29.0 52.0 19.0 35<br />
Upper Primary with Sec./H. Sec<br />
64 45.3 25.0 29.7 52<br />
Position of teachers by educational qualification (Other than Contractual-teachers)<br />
School category<br />
Below<br />
Secondary Higher<br />
Secondary<br />
Secondary Graduate<br />
Primary only<br />
88 119 125 85<br />
Primary with Upper Primary<br />
6 20 35 47<br />
Primary with U. P. Sec/ Hr. Sec.<br />
8 15 40 84<br />
Upper Primary only<br />
17 16 15 51<br />
Upper Primary with Sec./Higher Secondary 14 14 11 48<br />
Contractual-teachers<br />
Gender & caste distribution of teachers*<br />
School category Avg. No. of Tchs.<br />
Primary only<br />
3.9<br />
Primary with Upper Prim.<br />
11.7<br />
Prim.with U.P.Sec/Hr.Sec<br />
14.9<br />
Upper Primary only<br />
6.7<br />
U. Primary with Sec./Hr.S<br />
12.9<br />
Enrolment by medium of instructions*<br />
Pucca<br />
No. of schools by type of building*<br />
Post<br />
No<br />
Graduate M. Phil. Others response<br />
Enrolment<br />
All With disability<br />
Girls Boys Girls<br />
1,400 19 8<br />
1,241 11 12<br />
1,186 9 12<br />
1,021 8 3<br />
946 2 2<br />
1,358 3 4<br />
1,185 3 1<br />
1,157 5 5<br />
9,494 60 47<br />
Partially<br />
Multiple No<br />
Pucca Kuchcha Tent Type Building<br />
3 96 9 0 0 0<br />
1 2 4 0 3 0<br />
2 5 0 0 4 0<br />
2 15 0 0 0 0<br />
2 5 1 0 0 0<br />
5 1 0<br />
3 1 0 0<br />
15 0 2 0<br />
9 2 2 0<br />
6 1 0 0<br />
5 1 2 7 3 0 0 0<br />
Total<br />
Regular teachers Contractual-teachers SC teachers ST teachers<br />
Male Female No res Male Female No res Male Female Male Female<br />
425 271 152 0 2 0 0 1 0 271 151<br />
117 62 50 0 3 2 0 0 1 61 47<br />
164 87 77 0 0 0 0 3 1 67 71<br />
114 90 22 0 1 1 0 1 0 68 22<br />
103 55 39 0 6 3 0 2 0 43 36<br />
% Total Primary Upper Primary % Schools recvd.<br />
Grossness<br />
(Previous year)<br />
14.7<br />
34.8<br />
School T L M<br />
Others<br />
dev. grant grant<br />
Examination results<br />
(Previous academic year)<br />
Terminal % % Passed<br />
0 grade Passed with >60%<br />
V boys 92.3 2.0<br />
V girls 9.0 1.0<br />
V<strong>II</strong>I boys<br />
V<strong>II</strong>I girls<br />
%Teachers recvd.<br />
In-service training<br />
Male Female<br />
35.5 29.6<br />
7.7 19.2<br />
11.5 19.5<br />
11.0 13.0<br />
16.4 4.8<br />
Incentives : Number of beneficiaries<br />
(Previous academic year)<br />
Category English Hindi<br />
Incentive<br />
P. only<br />
5902<br />
90<br />
62<br />
83.3 87.0 Type<br />
P + UP<br />
3913<br />
0<br />
0<br />
0.0 0.0 Text books<br />
P+sec/hs<br />
5801<br />
0<br />
0<br />
0.0 0.0 Uniform<br />
U.P. only<br />
691<br />
237<br />
0<br />
94.1 94.1 Attendance<br />
UP+Sec<br />
2347<br />
0<br />
0<br />
75.0 75.0 Stationery<br />
# = not applicable na = not available * Some totals may not match due to no response in classificatory data items<br />
Primary Upper primary<br />
Boys Girls Boys Girls<br />
4230 3965 820 1025<br />
0 0 0 0<br />
34 23 0 2<br />
185 174 21 13<br />
401<br />
Nagaland


