

Volume II - DISE
Volume II - DISE
Volume II - DISE

You also want an ePaper? Increase the reach of your titles
YUMPU automatically turns print PDFs into web optimized ePapers that Google loves.
District<br />
KOLKATA<br />
State West Bengal<br />
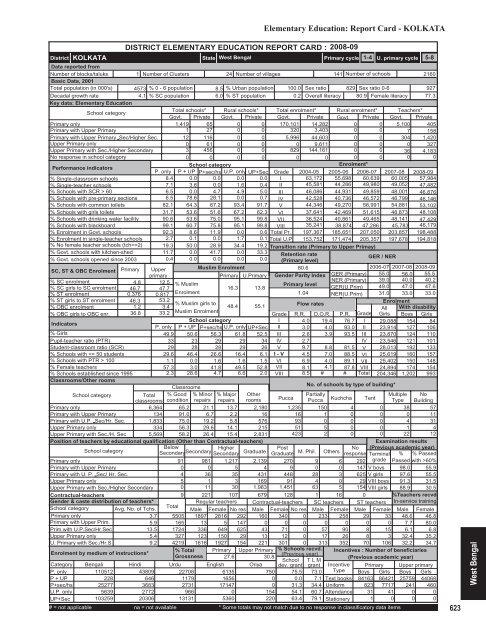
Elementary Education: Report Card - KOLKATA<br />
DISTRICT ELEMENTARY EDUCATION REPORT CARD : 2008-09<br />
Primary cycle<br />
1-4 U. primary cycle 5-8<br />
Data reported from<br />
Number of blocks/taluks<br />
1 Number of Clusters 24 Number of villages<br />
141 Number of schools<br />
2160<br />
Basic Data, 2001<br />
Total population (in 000's) 4573 % 0 - 6 population 8.5 % Urban population 100.0 Sex ratio 829 Sex ratio 0-6<br />
927<br />
Decadal growth rate<br />
4.1 % SC population 6.0 % ST population<br />
0.2 Overall literacy 80.9 Female literacy 77.3<br />
Key data: Elementary Education<br />
School category<br />
Total schools* Rural schools* Total enrolment* Rural enrolment* Teachers*<br />
Govt. Private Govt. Private Govt. Private Govt. Private Govt. Private<br />
Primary only<br />
1,419 65 0 0 170,101 14,282 0 0 5,100 405<br />
Primary with Upper Primary<br />
1 27 0 0 320 3,403 0 0 7 158<br />
Primary with Upper Primary Sec/Higher Sec. 12 116 0 0 5,996 44,603 0 0 304 1,420<br />
Upper Primary only<br />
0 61 0 0 0 9,611 0 0 0 327<br />
Upper Primary with Sec./Higher Secondary<br />
3 456 0 0 829 144,161 0 0 36 4,183<br />
No response in school category<br />
0 0 0 0 0 0 0 0 0 0<br />
Performance indicators<br />
School category<br />
Enrolment*<br />
P. only P + UP P+sec/hs U.P. only UP+Sec Grade 2004-05 2005-06 2006-07 2007-08 2008-09<br />
% Single-classroom schools<br />
8.4 0.0 0.0 0.0 0.0 I 63,172 55,698 60,639 60,005 57,984<br />
% Single-teacher schools<br />
7.1 3.6 0.0 1.6 0.4 <strong>II</strong> 45,581 44,286 49,980 49,052 47,482<br />
% Schools with SCR > 60<br />
6.5 0.0 4.7 4.9 5.0 <strong>II</strong>I 46,086 44,931 49,859 48,001 46,876<br />
% Schools with pre-primary sections 6.5 78.6 28.1 0.0 0.7 IV 42,528 40,736 46,572 46,799 46,146<br />
% Schools with common toilets 82.1 64.3 67.2 93.4 91.7 V 44,346 49,270 56,991 54,881 53,102<br />
% Schools with girls toilets 31.7 53.6 51.6 67.2 62.3 VI 37,641 42,469 51,615 48,873 48,108<br />
% Schools with drinking water facility 90.6 53.6 75.0 95.1 99.8 V<strong>II</strong> 36,524 40,861 49,465 48,141 47,429<br />
% Schools with blackboard<br />
99.1 60.7 75.8 95.1 99.8 V<strong>II</strong>I 35,241 38,874 47,286 45,783 46,179<br />
% Enrolment in Govt. schools 92.3 8.6 11.9 0.0 0.6 Total Pr. 197,367 185,651 207,050 203,857 198,488<br />
% Enrolment in single-teacher schools 2.7 0.1 0.0 1.7 0.1 Total U.P 153,752 171,474 205,357 197,678 194,818<br />
% No female teacher schools (tch>=2) 19.3 50.0 28.9 34.4 19.2 Transition rate (Primary to Upper Primay)<br />
% Govt. schools with kitchen-shed 11.7 0.0 41.7 0.0 33.3 Retention rate<br />
% Govt. schools opened since 2003 0.4 0.0 0.0 0.0 0.0 (Primary level)<br />
/ NER<br />
GER<br />
SC, ST & OBC Enrolment Primary Upper<br />
Muslim Enrolment<br />
80.6<br />
2006-07 2007-08 2008-09<br />
primary<br />
Primary U.Primary Gender Parity Index GER (Primary) 55.0 56.0 55.5<br />
% SC enrolment<br />
% SC girls to SC enrolment<br />
% ST enrolment<br />
% ST girls to ST enrolment<br />
% OBC enrolment<br />
% OBC girls to OBC enr.<br />
Indicators<br />
% Girls<br />
Pupil-teacher ratio (PTR)<br />
Student-classroom ratio (SCR)<br />
% Schools with 100<br />
% Female teachers<br />
% Schools established since 1995<br />
Classrooms/Other rooms<br />
4.8 12.5 % Muslim<br />
Primary level<br />
46.7 47.7<br />
16.3 13.8<br />
0.376 0.817<br />
Enrolment<br />
1.04<br />
46.3 53.2<br />
% Muslim girls to<br />
48.4 55.1<br />
Flow rates<br />
1.2 3.4<br />
36.8 33.2 Muslim Enrolment<br />
Grade<br />
School category<br />
I<br />
P. only P + UP P+sec/hs U.P. only UP+Sec <strong>II</strong><br />
49.9 50.6 56.3 61.8 52.5 <strong>II</strong>I<br />
33 23 29 29 34 IV<br />
29 28 28 29 26 V 9.7<br />
29.6 46.4 26.6 16.4 6.1 I - V 4.5<br />
1.1 0.0 1.6 1.6 1.5 VI 6.9<br />
57.3 3.0 41.8 49.5 52.8 V<strong>II</strong> 8.1<br />
2.3 28.6 4.7 6.6 2.0 V<strong>II</strong>I 8.5<br />
Classrooms<br />
School category<br />
Total<br />
classrooms<br />
% Good<br />
condition<br />
% Minor<br />
repairs<br />
% Major<br />
repairs<br />
Other<br />
rooms<br />
Primary only<br />
6,364 65.2 21.1 13.7 2,180<br />
Primary with Upper Primary<br />
134 91.0 6.7 2.2 16<br />
Primary with U.P. Sec/Hr. Sec. 1,833 75.0 19.2 5.8 576<br />
Upper Primary only<br />
334 56.3 29.6 14.1 215<br />
Upper Primary with Sec./H. Sec 5,569 58.2 26.4 15.4 2,831<br />
Position of teachers by educational qualification (Other than Contractual-teachers)<br />
School category<br />
Below<br />
Secondary Higher<br />
Secondary<br />
Secondary Graduate<br />
Primary only<br />
91 981 1,217 2,139<br />
Primary with Upper Primary<br />
0 0 5 4<br />
Primary with U. P. Sec/ Hr. Sec.<br />
4 36 35 431<br />
Upper Primary only<br />
5 1 3 169<br />
Upper Primary with Sec./Higher Secondary<br />
0 11 30 1,983<br />
Contractual-teachers<br />
Gender & caste distribution of teachers*<br />
School category Avg. No. of Tchs.<br />
Primary only<br />
3.7<br />
Primary with Upper Prim.<br />
5.9<br />
Prim.with U.P.Sec/Hr.Sec<br />
13.5<br />
Upper Primary only<br />
5.4<br />
U. Primary with Sec./Hr.S<br />
9.2<br />
Enrolment by medium of instructions*<br />
NER (Primary)<br />
GER(U.Prim)<br />
NER(U.Prim)<br />
Grade<br />
19.4 76.7 I<br />
4.0 93.0 <strong>II</strong><br />
3.9 93.5 <strong>II</strong>I<br />
IV<br />
8.8 81.5 V<br />
7.0 88.5 VI<br />
4.0 89.1 V<strong>II</strong><br />
4.1 87.8 V<strong>II</strong>I<br />
# # Total<br />
R.R. D.O.R. P.R.<br />
4.0<br />
3.0<br />
2.6<br />
2.7<br />
39.0<br />
49.0<br />
31.0<br />
No. of schools by type of building*<br />
Post<br />
No<br />
Graduate M. Phil. Others response<br />
40.0<br />
47.0<br />
33.0<br />
40.2<br />
47.6<br />
33.0<br />
Enrolment<br />
All With disability<br />
Girls Boys Girls<br />
29,088 154 84<br />
23,914 127 106<br />
23,870 124 110<br />
23,546 121 101<br />
28,013 192 133<br />
25,619 160 157<br />
25,402 150 148<br />
24,894 174 154<br />
204,346 1,202 993<br />
Pucca<br />
Partially<br />
Multiple No<br />
Pucca Kuchcha Tent Type Building<br />
1,235 150 4 0 38 57<br />
16 1 0 0 0 11<br />
93 0 0 0 4 31<br />
51 5 0 0 1 4<br />
423 2 0 0 22 12<br />
270 9 6<br />
9 0 0 147<br />
448 28 3 625<br />
91 4 0 29<br />
1,451 63 5 154<br />
9 221 107 679 128 1 16 0<br />
Total<br />
Regular teachers Contractual-teachers SC teachers ST teachers<br />
Male Female No res Male Female No res Male Female Male Female<br />
5505 1897 2816 292 160 340 0 233 258 29 33<br />
165 13 5 147 0 0 0 0 0 0 0<br />
1724 336 649 625 43 71 0 57 90 8 15<br />
327 123 150 29 13 12 0 17 26 8 3<br />
4219 1616 1927 154 221 301 0 313 352 70 106<br />
% Total Primary Upper Primary % Schools recvd.<br />
Grossness<br />
(Previous year)<br />
27.6<br />
30.8<br />
School T L M<br />
Urdu English Oriya dev. grant grant<br />
Examination results<br />
(Previous academic year)<br />
Terminal % % Passed<br />
292 grade Passed with >60%<br />
V boys 98.0 55.9<br />
V girls 97.6 55.5<br />
V<strong>II</strong>I boys 91.3 31.5<br />
V<strong>II</strong>I girls 88.9 30.5<br />
%Teachers recvd.<br />
In-service training<br />
Male Female<br />
48.6 46.8<br />
7.7 80.0<br />
6.1 6.8<br />
32.4 35.2<br />
32.2 34.7<br />
Incentives : Number of beneficiaries<br />
(Previous academic year)<br />
Category<br />
P. only<br />
Bengali<br />
110512<br />
Hindi<br />
43809 22708<br />
6135<br />
750 75.5 73.0<br />
Incentive<br />
Type<br />
P + UP<br />
228<br />
646<br />
1179<br />
1656<br />
0 0.0 7.1 Text books<br />
P+sec/hs 25277<br />
3683<br />
2731 17147<br />
0 31.3 34.4 Uniform<br />
U.P. only<br />
5639<br />
2772<br />
966<br />
0<br />
154 54.1 60.7 Attendance<br />
UP+Sec 103259 20306 13131<br />
5360<br />
220 63.4 79.1 Stationery<br />
# = not applicable na = not available * Some totals may not match due to no response in classificatory data items<br />
Primary Upper primary<br />
Boys Girls Boys Girls<br />
84163 86421 25759 44068<br />
823 7717 241 460<br />
31 41 0 0<br />
1 0 0 0<br />
623<br />
West Bengal


