

Volume II - DISE
Volume II - DISE
Volume II - DISE

Create successful ePaper yourself
Turn your PDF publications into a flip-book with our unique Google optimized e-Paper software.
District<br />
JAISALMER<br />
State Rajasthan<br />
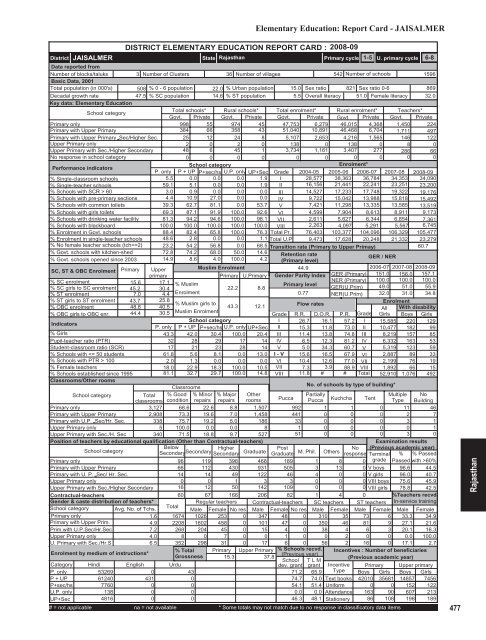
Elementary Education: Report Card - JAISALMER<br />
DISTRICT ELEMENTARY EDUCATION REPORT CARD : 2008-09<br />
Primary cycle<br />
1-5 U. primary cycle 6-8<br />
Data reported from<br />
Number of blocks/taluks<br />
3 Number of Clusters 36 Number of villages<br />
542 Number of schools<br />
1596<br />
Basic Data, 2001<br />
Total population (in 000's) 508 % 0 - 6 population 22.0 % Urban population 15.0 Sex ratio 821 Sex ratio 0-6<br />
869<br />
Decadal growth rate<br />
47.5 % SC population 14.6 % ST population<br />
5.5 Overall literacy 51.0 Female literacy 32.0<br />
Key data: Elementary Education<br />
School category<br />
Total schools* Rural schools* Total enrolment* Rural enrolment* Teachers*<br />
Govt. Private Govt. Private Govt. Private Govt. Private Govt. Private<br />
Primary only<br />
998 55 974 45 47,753 6,279 46,015 4,368 1,450 224<br />
Primary with Upper Primary<br />
384 66 358 43 51,040 10,891 46,468 6,704 1,711 497<br />
Primary with Upper Primary Sec/Higher Sec. 25 12 24 8 5,107 2,653 4,216 1,565 146 122<br />
Upper Primary only<br />
2 0 2 0 138 0 138 0 8 0<br />
Upper Primary with Sec./Higher Secondary<br />
48 6 45 1 3,734 1,161 3,407 277 286 66<br />
No response in school category<br />
0 0 0 0 0 0 0 0 0 0<br />
Performance indicators<br />
School category<br />
Enrolment*<br />
P. only P + UP P+sec/hs U.P. only UP+Sec Grade 2004-05 2005-06 2006-07 2007-08 2008-09<br />
% Single-classroom schools<br />
5.5 0.0 0.0 0.0 1.9 I 28,577 38,363 36,784 34,353 34,090<br />
% Single-teacher schools<br />
59.1 5.1 0.0 0.0 1.9 <strong>II</strong> 16,156 21,441 22,241 23,251 23,200<br />
% Schools with SCR > 60<br />
3.0 0.9 0.0 0.0 0.0 <strong>II</strong>I 14,527 17,233 17,748 19,322 19,176<br />
% Schools with pre-primary sections 4.4 10.9 27.0 0.0 0.0 IV 9,722 15,042 13,988 15,818 15,492<br />
% Schools with common toilets 39.3 62.7 81.1 0.0 53.7 V 7,421 11,298 13,335 13,585 13,519<br />
% Schools with girls toilets 69.3 87.1 91.9 100.0 92.6 VI 4,599 7,904 8,613 8,911 9,173<br />
% Schools with drinking water facility 81.3 94.2 94.6 100.0 98.1 V<strong>II</strong> 2,611 5,627 6,344 6,854 7,361<br />
% Schools with blackboard<br />
100.0 100.0 100.0 100.0 100.0 V<strong>II</strong>I 2,263 4,097 5,291 5,567 6,745<br />
% Enrolment in Govt. schools 88.4 82.4 65.8 100.0 76.3 Total Pr. 76,403 103,377 104,096 106,329 105,477<br />
% Enrolment in single-teacher schools 48.6 2.8 0.0 0.0 1.1 Total U.P 9,473 17,628 20,248 21,332 23,279<br />
% No female teacher schools (tch>=2) 23.2 54.2 56.8 0.0 68.5 Transition rate (Primary to Upper Primay)<br />
60.7<br />
% Govt. schools with kitchen-shed 72.8 74.2 68.0 50.0 14.6 Retention rate<br />
% Govt. schools opened since 2003 14.9 8.6 4.0 100.0 4.2 (Primary level)<br />
/ NER<br />
GER<br />
SC, ST & OBC Enrolment Primary Upper<br />
Muslim Enrolment<br />
44.9<br />
2006-07 2007-08 2008-09<br />
primary<br />
Primary U.Primary Gender Parity Index GER (Primary) 151.0 156.0 157.1<br />
% SC enrolment<br />
% SC girls to SC enrolment<br />
% ST enrolment<br />
% ST girls to ST enrolment<br />
% OBC enrolment<br />
% OBC girls to OBC enr.<br />
Indicators<br />
% Girls<br />
Pupil-teacher ratio (PTR)<br />
Student-classroom ratio (SCR)<br />
% Schools with 100<br />
% Female teachers<br />
% Schools established since 1995<br />
Classrooms/Other rooms<br />
15.6 17.1 % Muslim<br />
Primary level<br />
45.2 30.4<br />
22.2 8.8<br />
7.0 4.4 Enrolment<br />
0.77<br />
43.7 25.8<br />
% Muslim girls to<br />
43.3 12.1<br />
Flow rates<br />
48.8 40.5<br />
44.4 30.5 Muslim Enrolment<br />
Grade<br />
School category<br />
I<br />
P. only P + UP P+sec/hs U.P. only UP+Sec <strong>II</strong><br />
43.3 42.0 30.4 100.0 20.4 <strong>II</strong>I<br />
32 28 29 17 14 IV<br />
17 21 23 28 14 V<br />
61.8 5.6 8.1 0.0 13.0 I - V<br />
2.0 1.3 0.0 0.0 0.0 VI<br />
18.0 22.9 18.3 100.0 10.5 V<strong>II</strong><br />
81.1 32.7 29.7 100.0 14.8 V<strong>II</strong>I<br />
Classrooms<br />
School category<br />
Total<br />
classrooms<br />
% Good<br />
condition<br />
% Minor<br />
repairs<br />
% Major<br />
repairs<br />
Other<br />
rooms<br />
Primary only<br />
3,127 68.6 22.6 8.8 1,507<br />
Primary with Upper Primary<br />
2,908 73.3 19.6 7.0 1,458<br />
Primary with U.P. Sec/Hr. Sec.<br />
338 75.7 19.2 5.0 186<br />
Upper Primary only<br />
5 100.0 0.0 0.0<br />
8<br />
Upper Primary with Sec./H. Sec<br />
340 71.5 18.8 9.7 527<br />
Position of teachers by educational qualification (Other than Contractual-teachers)<br />
School category<br />
Below<br />
Secondary Higher<br />
Secondary<br />
Secondary Graduate<br />
Primary only<br />
96 119 398 468<br />
Primary with Upper Primary<br />
66 112 430 931<br />
Primary with U. P. Sec/ Hr. Sec.<br />
14 14 49 122<br />
Upper Primary only<br />
0 0 1 3<br />
Upper Primary with Sec./Higher Secondary 16 12 50 142<br />
Contractual-teachers<br />
Gender & caste distribution of teachers*<br />
School category Avg. No. of Tchs.<br />
Primary only<br />
1.6<br />
Primary with Upper Prim.<br />
4.9<br />
Prim.with U.P.Sec/Hr.Sec<br />
7.2<br />
Upper Primary only<br />
4.0<br />
U. Primary with Sec./Hr.S<br />
6.5<br />
Enrolment by medium of instructions*<br />
NER (Primary)<br />
GER(U.Prim)<br />
NER(U.Prim)<br />
R.R. D.O.R. P.R. Grade<br />
26.7 16.1 57.2 I<br />
15.3 11.8 73.0 <strong>II</strong><br />
11.4 13.8 74.8 <strong>II</strong>I<br />
6.5 12.3 81.2 IV<br />
5.0 34.3 60.7 V<br />
15.6 16.5 67.9 VI<br />
10.4 12.6 77.0 V<strong>II</strong><br />
7.3 3.9 88.9 V<strong>II</strong>I<br />
11.8 # # Total<br />
100.0<br />
49.0<br />
32.0<br />
No. of schools by type of building*<br />
Post<br />
No<br />
Graduate M. Phil. Others response<br />
100.0<br />
51.0<br />
31.0<br />
100.0<br />
55.9<br />
34.8<br />
Enrolment<br />
All With disability<br />
Girls Boys Girls<br />
15,585 220 129<br />
10,477 182 99<br />
8,219 157 85<br />
6,332 163 53<br />
5,319 123 59<br />
2,887 89 33<br />
2,199 76 19<br />
1,892 66 15<br />
52,910 1,076 492<br />
Pucca<br />
Partially<br />
Multiple No<br />
Pucca Kuchcha Tent Type Building<br />
992 1 1 0 11 46<br />
441 0 0 0 2 7<br />
33 0 0 0 3 1<br />
1 0 0 0 0 1<br />
51 0 0 0 3 0<br />
189 1 8<br />
505 3 13 0<br />
46 4 0 0<br />
3 0 0 0<br />
109 0 0 0<br />
60 67 166 206 82 1 4 0<br />
Total<br />
Regular teachers Contractual-teachers SC teachers ST teachers<br />
Male Female No res Male Female No res Male Female Male Female<br />
1674 1026 253 0 347 48 0 310 35 73 6<br />
2208 1602 458 0 101 47 0 350 46 81 9<br />
268 204 45 0 15 4 0 38 4 6 3<br />
8 0 7 0 0 1 0 0 2 0 0<br />
352 298 31 0 17 6 0 56 2 16 0<br />
% Total Primary Upper Primary % Schools recvd.<br />
Grossness<br />
(Previous year)<br />
15.3<br />
37.8<br />
School T L M<br />
Urdu<br />
dev. grant grant<br />
Examination results<br />
(Previous academic year)<br />
Terminal % % Passed<br />
0 grade Passed with >60%<br />
V boys 96.6 44.5<br />
V girls 96.0 40.7<br />
V<strong>II</strong>I boys 75.6 45.9<br />
V<strong>II</strong>I girls 78.8 42.5<br />
%Teachers recvd.<br />
In-service training<br />
Male Female<br />
33.3 34.9<br />
27.1 21.6<br />
20.1 16.3<br />
0.0 100.0<br />
17.1 2.7<br />
Incentives : Number of beneficiaries<br />
(Previous academic year)<br />
Category Hindi English<br />
Incentive<br />
P. only<br />
53269<br />
0<br />
43<br />
71.2 65.9 Type<br />
P + UP<br />
61240<br />
431<br />
0<br />
74.7 74.0 Text books<br />
P+sec/hs<br />
7760<br />
0<br />
0<br />
54.1 51.4 Uniform<br />
U.P. only<br />
138<br />
0<br />
0<br />
0.0 0.0 Attendance<br />
UP+Sec<br />
4816<br />
0<br />
0<br />
46.3 48.1 Stationery<br />
# = not applicable na = not available * Some totals may not match due to no response in classificatory data items<br />
Primary Upper primary<br />
Boys Girls Boys Girls<br />
42010 35681 14857 7456<br />
0 0 152 122<br />
163 90 607 213<br />
86 108 198 189<br />
477<br />
Rajasthan


