

Volume II - DISE
Volume II - DISE
Volume II - DISE

Create successful ePaper yourself
Turn your PDF publications into a flip-book with our unique Google optimized e-Paper software.
District<br />
BUDAUN<br />
State Uttar Pradesh<br />
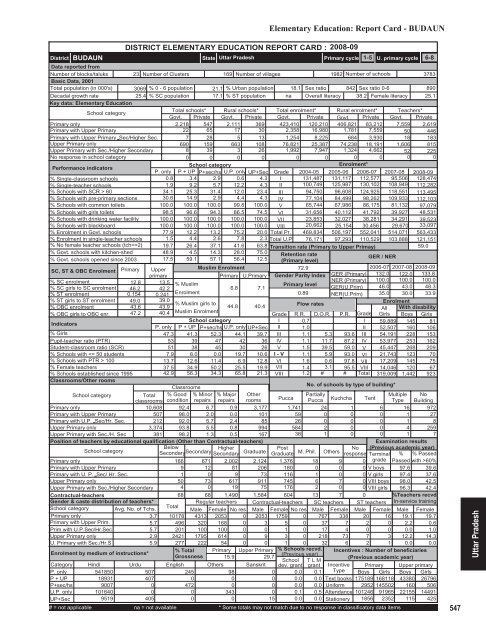
Elementary Education: Report Card - BUDAUN<br />
DISTRICT ELEMENTARY EDUCATION REPORT CARD : 2008-09<br />
Primary cycle<br />
1-5 U. primary cycle 6-8<br />
Data reported from<br />
Number of blocks/taluks 23 Number of Clusters 169 Number of villages<br />
1982 Number of schools<br />
3783<br />
Basic Data, 2001<br />
Total population (in 000's) 3069 % 0 - 6 population 21.1 % Urban population 18.1 Sex ratio 842 Sex ratio 0-6<br />
890<br />
Decadal growth rate<br />
25.4 % SC population 17.1 % ST population na Overall literacy 38.2 Female literacy 25.1<br />
Key data: Elementary Education<br />
School category<br />
Total schools* Rural schools* Total enrolment* Rural enrolment* Teachers*<br />
Govt. Private Govt. Private Govt. Private Govt. Private Govt. Private<br />
Primary only<br />
2,218 547 2,111 369 423,410 120,210 406,821 83,212 7,559 2,619<br />
Primary with Upper Primary<br />
22 65 17 30 2,358 16,980 1,781 7,559 50 446<br />
Primary with Upper Primary Sec/Higher Sec.<br />
7 28 5 13 1,254 8,225 684 3,930 18 183<br />
Upper Primary only<br />
690 159 663 108 76,821 25,387 74,238 18,191 1,606 815<br />
Upper Primary with Sec./Higher Secondary<br />
8 39 3 26 1,992 7,947 1,324 4,662 52 225<br />
No response in school category<br />
0 0 0 0 0 0 0 0 0 0<br />
Performance indicators<br />
School category<br />
Enrolment*<br />
P. only P + UP P+sec/hs U.P. only UP+Sec Grade 2004-05 2005-06 2006-07 2007-08 2008-09<br />
% Single-classroom schools<br />
0.8 3.4 2.9 0.6 4.3 I 131,487 131,117 112,577 95,506 128,474<br />
% Single-teacher schools<br />
1.9 9.2 5.7 12.2 4.3 <strong>II</strong> 100,749 125,987 130,102 108,949 112,282<br />
% Schools with SCR > 60<br />
34.1 25.3 31.4 12.0 23.4 <strong>II</strong>I 94,750 96,608 124,925 118,551 113,495<br />
% Schools with pre-primary sections 30.6 14.9 2.9 4.4 4.3 IV 77,104 84,499 98,262 109,933 112,103<br />
% Schools with common toilets 100.0 100.0 100.0 99.8 100.0 V 65,744 67,986 86,175 81,132 97,079<br />
% Schools with girls toilets 98.5 96.6 94.3 86.5 74.5 VI 31,656 40,112 41,792 39,927 48,531<br />
% Schools with drinking water facility 100.0 100.0 100.0 100.0 100.0 V<strong>II</strong> 23,853 32,027 38,281 34,291 39,523<br />
% Schools with blackboard<br />
100.0 100.0 100.0 100.0 100.0 V<strong>II</strong>I 20,662 25,154 30,456 29,670 33,097<br />
% Enrolment in Govt. schools 77.9 12.2 13.2 75.2 20.0 Total Pr. 469,834 506,197 552,041 514,071 563,433<br />
% Enrolment in single-teacher schools 1.5 4.4 2.6 7.8 2.3 Total U.P 76,171 97,293 110,529 103,888 121,151<br />
% No female teacher schools (tch>=2) 19.7 26.4 37.1 41.6 63.8 Transition rate (Primary to Upper Primay)<br />
59.0<br />
% Govt. schools with kitchen-shed 48.9 4.5 14.3 28.0 75.0 Retention rate<br />
% Govt. schools opened since 2003 17.5 59.1 57.1 56.4 12.5 (Primary level)<br />
/ NER<br />
GER<br />
SC, ST & OBC Enrolment Primary Upper<br />
Muslim Enrolment<br />
72.9<br />
2006-07 2007-08 2008-09<br />
primary<br />
Primary U.Primary Gender Parity Index GER (Primary) 132.0 122.0 133.8<br />
% SC enrolment<br />
% SC girls to SC enrolment<br />
% ST enrolment<br />
% ST girls to ST enrolment<br />
% OBC enrolment<br />
% OBC girls to OBC enr.<br />
Indicators<br />
% Girls<br />
Pupil-teacher ratio (PTR)<br />
Student-classroom ratio (SCR)<br />
% Schools with 100<br />
% Female teachers<br />
% Schools established since 1995<br />
Classrooms/Other rooms<br />
12.8 13.5 % Muslim<br />
Primary level<br />
46.2 42.2<br />
6.8 7.1<br />
0.154 0.241<br />
Enrolment<br />
0.89<br />
49.0 39.0<br />
% Muslim girls to<br />
44.8 40.4<br />
Flow rates<br />
43.6 43.9<br />
47.2 40.4 Muslim Enrolment<br />
Grade<br />
School category<br />
I<br />
P. only P + UP P+sec/hs U.P. only UP+Sec <strong>II</strong><br />
47.3 41.3 52.3 44.1 39.7 <strong>II</strong>I<br />
53 39 47 42 36 IV<br />
51 38 45 30 26 V 1.5<br />
7.9 8.0 0.0 19.7 10.6 I - V 1.1<br />
13.7 12.6 11.4 6.9 12.8 VI 1.6<br />
37.5 34.9 50.2 25.5 19.9 V<strong>II</strong> 1.4<br />
42.9 56.3 34.3 65.8 21.3 V<strong>II</strong>I 1.2<br />
Classrooms<br />
School category<br />
Total<br />
classrooms<br />
% Good<br />
condition<br />
% Minor<br />
repairs<br />
% Major<br />
repairs<br />
Other<br />
rooms<br />
Primary only<br />
10,608 92.4 6.7 0.9 3,177<br />
Primary with Upper Primary<br />
507 98.0 2.0 0.0 101<br />
Primary with U.P. Sec/Hr. Sec.<br />
212 92.0 5.7 2.4 85<br />
Upper Primary only<br />
3,374 93.8 5.5 0.8 994<br />
Upper Primary with Sec./H. Sec<br />
381 98.2 1.3 0.5 167<br />
Position of teachers by educational qualification (Other than Contractual-teachers)<br />
School category<br />
Below<br />
Secondary Higher<br />
Secondary<br />
Secondary Graduate<br />
Primary only<br />
166 671 2,002 2,124<br />
Primary with Upper Primary<br />
9 12 81 206<br />
Primary with U. P. Sec/ Hr. Sec.<br />
1 0 9 73<br />
Upper Primary only<br />
50 73 617 911<br />
Upper Primary with Sec./Higher Secondary<br />
4 0 19 75<br />
Contractual-teachers<br />
Gender & caste distribution of teachers*<br />
School category Avg. No. of Tchs.<br />
Primary only<br />
3.7<br />
Primary with Upper Prim.<br />
5.7<br />
Prim.with U.P.Sec/Hr.Sec<br />
5.7<br />
Upper Primary only<br />
2.9<br />
U. Primary with Sec./Hr.S<br />
5.9<br />
Enrolment by medium of instructions*<br />
NER (Primary)<br />
GER(U.Prim)<br />
NER(U.Prim)<br />
Grade<br />
I<br />
<strong>II</strong><br />
5.3 93.6 <strong>II</strong>I<br />
11.7 87.2 IV<br />
39.5 59.0 V<br />
5.9 93.0 VI<br />
0.6 97.8 V<strong>II</strong><br />
3.1 95.5 V<strong>II</strong>I<br />
# # Total<br />
R.R. D.O.R. P.R.<br />
0.7<br />
1.0<br />
1.1<br />
1.1<br />
100.0<br />
46.0<br />
35.0<br />
No. of schools by type of building*<br />
Post<br />
No<br />
Graduate M. Phil. Others response<br />
100.0<br />
43.0<br />
30.0<br />
100.0<br />
48.3<br />
33.9<br />
Enrolment<br />
All With disability<br />
Girls Boys Girls<br />
59,889 145 81<br />
52,507 160 106<br />
54,191 228 153<br />
53,977 253 162<br />
45,447 268 209<br />
21,743 123 70<br />
17,209 145 75<br />
14,046 120 67<br />
319,009 1,442 923<br />
Pucca<br />
Partially<br />
Multiple No<br />
Pucca Kuchcha Tent Type Building<br />
1,741 24 1 6 16 972<br />
59 0 0 0 1 27<br />
26 0 0 0 1 8<br />
584 2 0 0 4 259<br />
38 1 0 0 1 7<br />
1,376 18 9<br />
180 0 0 0<br />
116 1 0 0<br />
745 6 7 0<br />
176 2 0 0<br />
68 68 1,490 1,584 604 13 7 0<br />
Total<br />
Regular teachers Contractual-teachers SC teachers ST teachers<br />
Male Female No res Male Female No res Male Female Male Female<br />
10178 4313 2053 0 2053 1759 0 767 338 20 16<br />
496 320 168 0 3 5 0 37 7 2 0<br />
201 100 100 0 0 1 0 17 4 0 0<br />
2421 1795 614 0 9 3 0 218 73 7 3<br />
277 222 54 0 0 1 0 32 6 2 1<br />
% Total Primary Upper Primary % Schools recvd.<br />
Grossness<br />
(Previous year)<br />
15.9<br />
29.7<br />
School T L M<br />
English Others Sanskrit dev. grant grant<br />
Examination results<br />
(Previous academic year)<br />
Terminal % % Passed<br />
0 grade Passed with >60%<br />
V boys 97.6 39.6<br />
V girls 97.4 37.6<br />
V<strong>II</strong>I boys 98.0 42.5<br />
V<strong>II</strong>I girls 96.3 42.4<br />
%Teachers recvd.<br />
In-service training<br />
Male Female<br />
19.1 19.7<br />
2.2 0.6<br />
0.0 1.0<br />
12.2 14.3<br />
0.0 0.0<br />
Incentives : Number of beneficiaries<br />
(Previous academic year)<br />
Category Hindi<br />
Urdu<br />
Incentive<br />
P. only<br />
541850<br />
507<br />
245<br />
98<br />
0 0.0 0.1 Type<br />
P + UP<br />
18931<br />
407<br />
0<br />
0<br />
0 0.0 0.0 Text books<br />
P+sec/hs<br />
9007<br />
0<br />
472<br />
0<br />
0 0.0 0.0 Uniform<br />
U.P. only 101640<br />
0<br />
0<br />
343<br />
0 0.1 0.5 Attendance<br />
UP+Sec<br />
9519<br />
405<br />
0<br />
0<br />
15 0.0 0.0 Stationery<br />
# = not applicable na = not available * Some totals may not match due to no response in classificatory data items<br />
Primary Upper primary<br />
Boys Girls Boys Girls<br />
175189 168118 43380 26796<br />
2952 145502 160 506<br />
101246 91965 22155 14491<br />
1856 2352 115 425<br />
547<br />
Uttar Pradesh


