

Volume II - DISE
Volume II - DISE
Volume II - DISE

You also want an ePaper? Increase the reach of your titles
YUMPU automatically turns print PDFs into web optimized ePapers that Google loves.
Uttar Pradesh<br />
536<br />
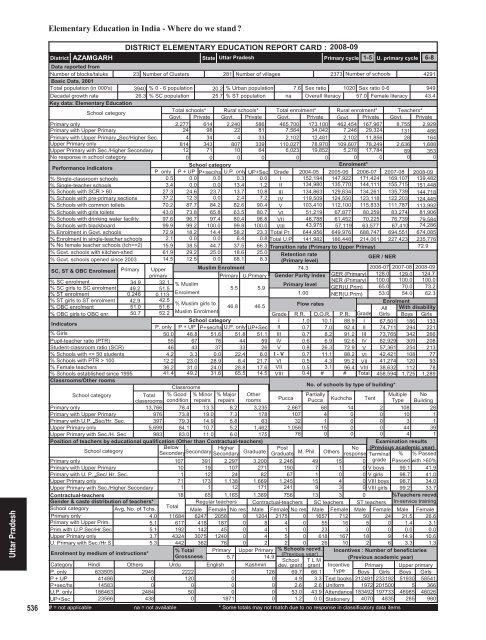
Elementary Education in India - Where do we stand <br />
District<br />
AZAMGARH<br />
DISTRICT ELEMENTARY EDUCATION REPORT CARD : 2008-09<br />
State Uttar Pradesh<br />
Primary cycle<br />
1-5 U. primary cycle 6-8<br />
Data reported from<br />
Number of blocks/taluks 23 Number of Clusters 281 Number of villages<br />
2373 Number of schools<br />
4291<br />
Basic Data, 2001<br />
Total population (in 000's) 3940 % 0 - 6 population 20.2 % Urban population 7.6 Sex ratio 1020 Sex ratio 0-6<br />
949<br />
Decadal growth rate<br />
26.3 % SC population 25.7 % ST population na Overall literacy 57.0 Female literacy 43.4<br />
Key data: Elementary Education<br />
School category<br />
Total schools* Rural schools* Total enrolment* Rural enrolment* Teachers*<br />
Govt. Private Govt. Private Govt. Private Govt. Private Govt. Private<br />
Primary only<br />
2,277 614 2,240 586 465,700 173,100 462,454 167,967 8,755 2,929<br />
Primary with Upper Primary<br />
24 98 22 81 7,564 34,042 7,246 29,324 131 486<br />
Primary with Upper Primary Sec/Higher Sec.<br />
4 34 4 33 2,102 12,481 2,102 11,856 28 164<br />
Upper Primary only<br />
814 343 807 339 110,027 78,970 109,607 78,249 2,636 1,688<br />
Upper Primary with Sec./Higher Secondary<br />
12 71 10 64 6,023 19,852 5,278 17,784 89 353<br />
No response in school category<br />
0 0 0 0 0 0 0 0 0 0<br />
Performance indicators<br />
School category<br />
Enrolment*<br />
P. only P + UP P+sec/hs U.P. only UP+Sec Grade 2004-05 2005-06 2006-07 2007-08 2008-09<br />
% Single-classroom schools<br />
0.5 0.0 0.0 0.3 0.0 I 152,194 147,922 171,424 169,107 139,482<br />
% Single-teacher schools<br />
3.4 0.0 0.0 13.4 1.2 <strong>II</strong> 134,980 135,770 144,111 155,715 151,448<br />
% Schools with SCR > 60<br />
27.3 24.6 23.7 13.7 10.8 <strong>II</strong>I 134,863 129,634 134,261 135,739 144,718<br />
% Schools with pre-primary sections 37.2 12.3 0.0 2.4 7.2 IV 119,509 124,550 123,118 122,203 124,445<br />
% Schools with common toilets 70.2 87.7 84.2 82.6 90.4 V 103,410 112,100 115,833 111,787 113,992<br />
% Schools with girls toilets 43.0 73.8 65.8 63.5 80.7 VI 51,219 67,877 80,259 83,274 81,906<br />
% Schools with drinking water facility 97.6 96.7 97.4 80.4 98.8 V<strong>II</strong> 46,788 61,452 70,225 76,739 79,584<br />
% Schools with blackboard<br />
99.9 99.2 100.0 99.8 100.0 V<strong>II</strong>I 43,975 57,119 63,577 67,410 74,286<br />
% Enrolment in Govt. schools 72.9 18.2 14.4 58.2 23.3 Total Pr. 644,956 649,976 688,747 694,551 674,085<br />
% Enrolment in single-teacher schools 2.1 0.0 0.0 6.4 0.8 Total U.P 141,982 186,448 214,061 227,423 235,776<br />
% No female teacher schools (tch>=2) 15.9 38.5 44.7 37.5 66.3 Transition rate (Primary to Upper Primay)<br />
72.9<br />
% Govt. schools with kitchen-shed 61.9 29.2 25.0 18.6 25.0 Retention rate<br />
% Govt. schools opened since 2003 14.5 12.5 0.0 68.1 8.3 (Primary level)<br />
/ NER<br />
GER<br />
SC, ST & OBC Enrolment Primary Upper<br />
Muslim Enrolment<br />
74.3<br />
2006-07 2007-08 2008-09<br />
primary<br />
Primary U.Primary Gender Parity Index GER (Primary) 128.0 129.0 124.7<br />
% SC enrolment<br />
% SC girls to SC enrolment<br />
% ST enrolment<br />
% ST girls to ST enrolment<br />
% OBC enrolment<br />
% OBC girls to OBC enr.<br />
Indicators<br />
% Girls<br />
Pupil-teacher ratio (PTR)<br />
Student-classroom ratio (SCR)<br />
% Schools with 100<br />
% Female teachers<br />
% Schools established since 1995<br />
Classrooms/Other rooms<br />
34.9 32.1 % Muslim<br />
Primary level<br />
49.2 51.5<br />
5.5 5.9<br />
0.246 0.113<br />
Enrolment<br />
1.00<br />
42.9 42.5<br />
% Muslim girls to<br />
46.8 46.5<br />
Flow rates<br />
51.0 51.6<br />
50.7 52.2 Muslim Enrolment<br />
Grade<br />
School category<br />
I<br />
P. only P + UP P+sec/hs U.P. only UP+Sec <strong>II</strong><br />
50.0 48.8 51.6 51.8 51.1 <strong>II</strong>I<br />
55 67 76 44 59 IV<br />
46 43 37 33 26 V 0.8<br />
4.2 3.3 0.0 22.4 6.0 I - V 0.7<br />
12.2 23.0 28.9 8.4 21.7 VI 0.5<br />
36.2 31.0 24.0 28.8 17.6 V<strong>II</strong> 0.5<br />
41.4 49.2 31.6 65.5 14.5 V<strong>II</strong>I 0.4<br />
Classrooms<br />
School category<br />
Total<br />
classrooms<br />
% Good<br />
condition<br />
% Minor<br />
repairs<br />
% Major<br />
repairs<br />
Other<br />
rooms<br />
Primary only<br />
13,766 78.4 13.3 8.2 3,235<br />
Primary with Upper Primary<br />
976 73.8 19.0 7.3 178<br />
Primary with U.P. Sec/Hr. Sec.<br />
397 79.3 14.9 5.8 63<br />
Upper Primary only<br />
5,699 84.1 10.7 5.2 1,462<br />
Upper Primary with Sec./H. Sec<br />
983 83.0 11.0 6.0 175<br />
Position of teachers by educational qualification (Other than Contractual-teachers)<br />
School category<br />
Below<br />
Secondary Higher<br />
Secondary<br />
Secondary Graduate<br />
Primary only<br />
107 391 2,297 3,200<br />
Primary with Upper Primary<br />
10 19 107 271<br />
Primary with U. P. Sec/ Hr. Sec.<br />
1 12 24 82<br />
Upper Primary only<br />
71 173 1,138 1,669<br />
Upper Primary with Sec./Higher Secondary<br />
1 1 12 171<br />
Contractual-teachers<br />
Gender & caste distribution of teachers*<br />
School category Avg. No. of Tchs.<br />
Primary only<br />
4.0<br />
Primary with Upper Prim.<br />
5.1<br />
Prim.with U.P.Sec/Hr.Sec<br />
5.1<br />
Upper Primary only<br />
3.7<br />
U. Primary with Sec./Hr.S<br />
5.3<br />
Enrolment by medium of instructions*<br />
NER (Primary)<br />
GER(U.Prim)<br />
NER(U.Prim)<br />
Grade<br />
10.1 88.9 I<br />
7.0 92.4 <strong>II</strong><br />
8.2 91.2 <strong>II</strong>I<br />
6.9 92.6 IV<br />
26.3 72.9 V<br />
11.1 88.2 VI<br />
4.3 95.2 V<strong>II</strong><br />
3.1 96.4 V<strong>II</strong>I<br />
# # Total<br />
R.R. D.O.R. P.R.<br />
1.0<br />
0.7<br />
0.7<br />
0.6<br />
100.0<br />
65.0<br />
53.0<br />
No. of schools by type of building*<br />
Post<br />
No<br />
Graduate M. Phil. Others response<br />
100.0<br />
70.0<br />
54.0<br />
100.0<br />
73.2<br />
62.3<br />
Enrolment<br />
All With disability<br />
Girls Boys Girls<br />
67,501 186 133<br />
74,711 294 221<br />
73,765 342 266<br />
62,929 309 208<br />
57,361 254 213<br />
42,421 108 77<br />
41,274 120 93<br />
38,632 112 78<br />
458,594 1,725 1,289<br />
Pucca<br />
Partially<br />
Multiple No<br />
Pucca Kuchcha Tent Type Building<br />
2,667 68 14 2 108 28<br />
107 4 0 0 10 1<br />
32 1 0 0 3 1<br />
1,058 15 0 0 44 39<br />
78 0 0 0 4 1<br />
2,246 49 15<br />
190 7 1 0<br />
67 1 0 0<br />
1,245 15 4 0<br />
241 9 3 0<br />
18 65 1,165 1,389 756 13 3 0<br />
Total<br />
Regular teachers Contractual-teachers SC teachers ST teachers<br />
Male Female No res Male Female No res Male Female Male Female<br />
11684 6247 2058 0 1204 2175 0 1657 712 50 24<br />
617 418 187 0 8 4 0 55 16 5 0<br />
192 142 45 0 4 1 0 23 3 0 0<br />
4324 3075 1240 0 4 5 0 618 167 18 9<br />
442 362 76 0 2 2 0 26 10 2 6<br />
% Total Primary Upper Primary % Schools recvd.<br />
Grossness<br />
(Previous year)<br />
5.7<br />
14.9<br />
School T L M<br />
Urdu English<br />
dev. grant grant<br />
Examination results<br />
(Previous academic year)<br />
Terminal % % Passed<br />
0 grade Passed with >60%<br />
V boys 99.1 41.9<br />
V girls 98.7 41.0<br />
V<strong>II</strong>I boys 98.7 34.0<br />
V<strong>II</strong>I girls 99.2 33.7<br />
%Teachers recvd.<br />
In-service training<br />
Male Female<br />
21.5 26.6<br />
1.4 3.1<br />
0.0 0.0<br />
14.9 10.6<br />
3.3 1.3<br />
Incentives : Number of beneficiaries<br />
(Previous academic year)<br />
Category<br />
P. only<br />
Hindi<br />
633505<br />
Others<br />
2945<br />
2222<br />
0<br />
Kashmiri<br />
128 69.7 66.1<br />
Incentive<br />
Type<br />
P + UP<br />
41486<br />
0<br />
120<br />
0<br />
0 4.9 3.3 Text books<br />
P+sec/hs 14583<br />
0<br />
0<br />
0<br />
0 2.6 2.6 Uniform<br />
U.P. only 186463<br />
2484<br />
50<br />
0<br />
0 53.0 43.9 Attendance<br />
UP+Sec<br />
23566<br />
438<br />
0<br />
1871<br />
0 1.2 0.0 Stationery<br />
# = not applicable na = not available * Some totals may not match due to no response in classificatory data items<br />
Primary Upper primary<br />
Boys Girls Boys Girls<br />
212491 233192 51930 58541<br />
1972 201500 5 366<br />
183492 197733 46985 46026<br />
4070 4835 285 980


