

Volume II - DISE
Volume II - DISE
Volume II - DISE

Create successful ePaper yourself
Turn your PDF publications into a flip-book with our unique Google optimized e-Paper software.
District<br />
FIROZPUR<br />
State Punjab<br />
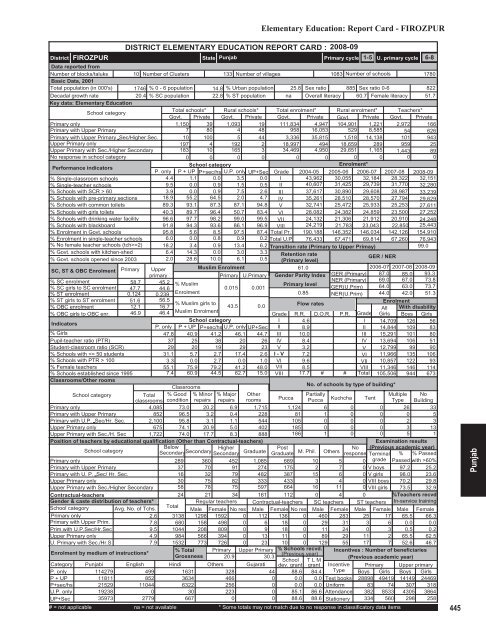
Elementary Education: Report Card - FIROZPUR<br />
DISTRICT ELEMENTARY EDUCATION REPORT CARD : 2008-09<br />
Primary cycle<br />
1-5 U. primary cycle 6-8<br />
Data reported from<br />
Number of blocks/taluks 10 Number of Clusters 133 Number of villages<br />
1083 Number of schools<br />
1780<br />
Basic Data, 2001<br />
Total population (in 000's) 1746 % 0 - 6 population 14.8 % Urban population 25.8 Sex ratio 885 Sex ratio 0-6<br />
822<br />
Decadal growth rate<br />
20.4 % SC population 22.8 % ST population na Overall literacy 60.7 Female literacy 51.7<br />
Key data: Elementary Education<br />
School category<br />
Total schools* Rural schools* Total enrolment* Rural enrolment* Teachers*<br />
Govt. Private Govt. Private Govt. Private Govt. Private Govt. Private<br />
Primary only<br />
1,150 39 1,093 19 111,834 4,947 104,901 1,221 2,972 166<br />
Primary with Upper Primary<br />
7 80 4 48 958 16,053 529 8,585 54 626<br />
Primary with Upper Primary Sec/Higher Sec. 10 100 5 44 3,336 35,815 1,518 14,138 101 943<br />
Upper Primary only<br />
197 4 192 2 18,997 494 18,659 289 959 25<br />
Upper Primary with Sec./Higher Secondary 183 10 165 3 34,469 4,950 29,651 1,165 1,443 89<br />
No response in school category<br />
0 0 0 0 0 0 0 0 0 0<br />
Performance indicators<br />
School category<br />
Enrolment*<br />
P. only P + UP P+sec/hs U.P. only UP+Sec Grade 2004-05 2005-06 2006-07 2007-08 2008-09<br />
% Single-classroom schools<br />
4.4 1.1 0.0 3.5 0.0 I 43,962 30,055 32,184 28,322 32,151<br />
% Single-teacher schools<br />
9.5 0.0 0.9 1.5 0.5 <strong>II</strong> 40,607 31,425 29,739 31,770 32,280<br />
% Schools with SCR > 60<br />
3.9 0.0 0.9 7.5 2.6 <strong>II</strong>I 37,617 30,890 29,608 28,987 33,239<br />
% Schools with pre-primary sections 18.9 55.2 64.5 2.0 4.7 IV 35,261 28,510 28,570 27,794 29,629<br />
% Schools with common toilets 89.3 93.1 87.3 87.1 94.8 V 32,741 25,472 25,933 25,253 27,611<br />
% Schools with girls toilets 40.3 89.7 96.4 50.7 83.4 VI 28,082 24,382 24,859 23,500 27,252<br />
% Schools with drinking water facility 96.6 97.7 98.2 99.0 99.5 V<strong>II</strong> 24,132 21,306 21,912 20,910 24,248<br />
% Schools with blackboard<br />
91.8 94.3 93.6 86.1 96.9 V<strong>II</strong>I 24,219 21,783 23,043 22,850 25,443<br />
% Enrolment in Govt. schools 95.8 5.6 8.5 97.5 87.4 Total Pr. 190,188 146,352 146,034 142,126 154,910<br />
% Enrolment in single-teacher schools 6.0 0.0 0.8 0.9 0.2 Total U.P 76,433 67,471 69,814 67,260 76,943<br />
% No female teacher schools (tch>=2) 18.2 3.4 0.9 13.4 6.2 Transition rate (Primary to Upper Primay)<br />
99.0<br />
% Govt. schools with kitchen-shed 6.4 14.3 0.0 3.0 3.3 Retention rate<br />
% Govt. schools opened since 2003 2.0 28.6 10.0 6.1 0.5 (Primary level)<br />
/ NER<br />
GER<br />
SC, ST & OBC Enrolment Primary Upper<br />
Muslim Enrolment<br />
61.0<br />
2006-07 2007-08 2008-09<br />
primary<br />
Primary U.Primary Gender Parity Index GER (Primary) 87.0 85.0 93.3<br />
% SC enrolment<br />
% SC girls to SC enrolment<br />
% ST enrolment<br />
% ST girls to ST enrolment<br />
% OBC enrolment<br />
% OBC girls to OBC enr.<br />
Indicators<br />
% Girls<br />
Pupil-teacher ratio (PTR)<br />
Student-classroom ratio (SCR)<br />
% Schools with 100<br />
% Female teachers<br />
% Schools established since 1995<br />
Classrooms/Other rooms<br />
58.7 45.2<br />
NER (Primary)<br />
% Muslim<br />
Primary level<br />
47.7 44.6<br />
0.015 0.001<br />
GER(U.Prim)<br />
0.124 0.239<br />
Enrolment<br />
0.85 NER(U.Prim)<br />
51.6 56.5<br />
% Muslim girls to<br />
43.5 0.0<br />
Flow rates<br />
12.1 16.7<br />
46.9 46.4 Muslim Enrolment<br />
Grade R.R. D.O.R. P.R.<br />
School category<br />
I 4.6<br />
P. only P + UP P+sec/hs U.P. only UP+Sec <strong>II</strong> 8.9<br />
47.8 40.9 41.2 46.1 44.7 <strong>II</strong>I 10.0<br />
37 25 38 20 26 IV 8.4<br />
29 20 19 29 23 V 3.2<br />
31.1 5.7 2.7 17.4 2.6 I - V 7.2<br />
3.3 0.0 2.7 0.0 1.0 VI 9.6<br />
55.1 75.9 79.2 41.2 48.0 V<strong>II</strong> 8.5<br />
7.4 60.9 44.5 62.7 15.0 V<strong>II</strong>I 17.7 # #<br />
Classrooms<br />
School category<br />
Total<br />
classrooms<br />
% Good<br />
condition<br />
% Minor<br />
repairs<br />
% Major<br />
repairs<br />
Other<br />
rooms<br />
Primary only<br />
4,085 73.0 20.2 6.9 1,715<br />
Primary with Upper Primary<br />
852 96.5 3.2 0.4 228<br />
Primary with U.P. Sec/Hr. Sec. 2,100 95.8 3.1 1.1 544<br />
Upper Primary only<br />
675 74.1 20.9 5.0 402<br />
Upper Primary with Sec./H. Sec 1,722 74.0 17.7 8.3 888<br />
Position of teachers by educational qualification (Other than Contractual-teachers)<br />
School category<br />
Below<br />
Secondary Higher<br />
Secondary<br />
Secondary Graduate<br />
Primary only<br />
289 360 452 1,085<br />
Primary with Upper Primary<br />
37 70 91 274<br />
Primary with U. P. Sec/ Hr. Sec.<br />
16 32 79 482<br />
Upper Primary only<br />
30 75 82 333<br />
Upper Primary with Sec./Higher Secondary 58 78 75 597<br />
Contractual-teachers<br />
Gender & caste distribution of teachers*<br />
School category Avg. No. of Tchs.<br />
Primary only<br />
2.6<br />
Primary with Upper Prim.<br />
7.8<br />
Prim.with U.P.Sec/Hr.Sec<br />
9.5<br />
Upper Primary only<br />
4.9<br />
U. Primary with Sec./Hr.S<br />
7.9<br />
Enrolment by medium of instructions*<br />
Grade<br />
I<br />
<strong>II</strong><br />
<strong>II</strong>I<br />
IV<br />
V<br />
VI<br />
V<strong>II</strong><br />
V<strong>II</strong>I<br />
Total<br />
69.0<br />
64.0<br />
44.0<br />
No. of schools by type of building*<br />
Post<br />
No<br />
Graduate M. Phil. Others response<br />
67.0<br />
63.0<br />
42.0<br />
73.8<br />
73.7<br />
51.3<br />
Enrolment<br />
All With disability<br />
Girls Boys Girls<br />
14,709 126 56<br />
14,844 109 83<br />
15,291 101 80<br />
13,694 106 51<br />
12,799 99 90<br />
11,966 135 106<br />
10,857 122 93<br />
11,346 146 114<br />
105,506 944 673<br />
Pucca<br />
Partially<br />
Multiple No<br />
Pucca Kuchcha Tent Type Building<br />
1,124 6 0 0 26 33<br />
81 1 0 0 0 5<br />
105 0 0 0 2 3<br />
185 0 0 0 3 13<br />
186 1 0 0 5 1<br />
689 10 5<br />
175 2 7 0<br />
387 15 6 0<br />
433 3 4 0<br />
664 16 11 0<br />
24 21 34 161 112 0 4 0<br />
Total<br />
Regular teachers Contractual-teachers SC teachers ST teachers<br />
Male Female No res Male Female No res Male Female Male Female<br />
3138 1298 1592 0 112 136 0 460 283 25 17<br />
680 158 498 0 6 18 0 29 31 3 6<br />
1044 208 809 0 9 18 0 11 24 0 3<br />
984 566 394 0 13 11 0 89 29 11 2<br />
1532 773 726 0 23 10 0 129 55 17 7<br />
% Total Primary Upper Primary % Schools recvd.<br />
Grossness<br />
(Previous year)<br />
20.9<br />
30.3<br />
School T L M<br />
Hindi Others Gujarati dev. grant grant<br />
Examination results<br />
(Previous academic year)<br />
Terminal % % Passed<br />
0 grade Passed with >60%<br />
V boys 97.2 25.2<br />
V girls 98.0 23.6<br />
V<strong>II</strong>I boys 70.2 29.8<br />
V<strong>II</strong>I girls 73.5 32.9<br />
%Teachers recvd.<br />
In-service training<br />
Male Female<br />
65.5 66.3<br />
0.0 0.0<br />
0.5 0.2<br />
65.5 62.5<br />
52.6 46.7<br />
Incentives : Number of beneficiaries<br />
(Previous academic year)<br />
Category Punjabi English<br />
Incentive<br />
P. only<br />
114279<br />
499<br />
1631<br />
328<br />
44 88.6 84.4 Type<br />
P + UP<br />
11811<br />
852<br />
3634<br />
466<br />
0 0.0 0.0 Text books<br />
P+sec/hs 21529 11044<br />
6322<br />
256<br />
0 0.0 0.0 Uniform<br />
U.P. only 19238<br />
0<br />
30<br />
223<br />
0 85.1 86.6 Attendance<br />
UP+Sec<br />
35973<br />
2779<br />
667<br />
0<br />
0 88.6 88.6 Stationery<br />
# = not applicable na = not available * Some totals may not match due to no response in classificatory data items<br />
Primary Upper primary<br />
Boys Girls Boys Girls<br />
28898 49419 14149 24469<br />
83 74 307 318<br />
382 8533 4305 3864<br />
334 560 298 258<br />
445<br />
Punjab


