Advice for the Project Management Professional (PMP)
Advice for the Project Management Professional (PMP)
Advice for the Project Management Professional (PMP)

You also want an ePaper? Increase the reach of your titles
YUMPU automatically turns print PDFs into web optimized ePapers that Google loves.
Licensed to:<br />
356<br />
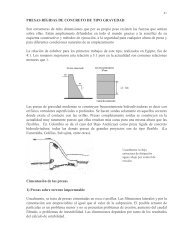
Appendix A<br />
To add lead and lag times:<br />
1. Open <strong>the</strong> Task In<strong>for</strong>mation dialog box <strong>for</strong> Task 11, Design. In <strong>the</strong> Task Name<br />
column, double-click <strong>the</strong> text <strong>for</strong> Task 11, Design. The Task In<strong>for</strong>mation dialog<br />
box opens. Click <strong>the</strong> Predecessors tab.<br />
2. Enter lead time <strong>for</strong> Task 11. Type –10% in <strong>the</strong> Lag column, as shown in Figure<br />
A-29. Click OK. You could also type a value such as –5d to indicate a fiveday<br />
overlap. In <strong>the</strong> resulting Gantt chart, notice that <strong>the</strong> bar <strong>for</strong> this task has<br />
moved slightly to <strong>the</strong> left. Also, notice that <strong>the</strong> project completion date has<br />
moved from 11/16 to 11/12.<br />
FIGURE A-29 Adding Lead or Lag Time to Task Dependencies<br />
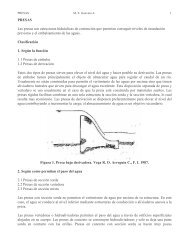
3. Enter lead time <strong>for</strong> Task 12. Double-click <strong>the</strong> text <strong>for</strong> Task 12, Implementation,<br />
type –3d in <strong>the</strong> Lag column, and click OK. Notice that <strong>the</strong> project now ends<br />
on 11/9.<br />
4. Enter lag time <strong>for</strong> Task 13. Double-click <strong>the</strong> text <strong>for</strong> Task 13, System<br />
Implemented, type 5d in <strong>the</strong> Lag column <strong>for</strong> this task, and click OK. Move <strong>the</strong><br />
split bar to <strong>the</strong> right, if necessary, to reveal <strong>the</strong> Predecessors column. Also<br />
double-click <strong>the</strong> Zoom In button to see <strong>the</strong> Gantt chart bars more clearly.<br />
When you are finished, your screen should resemble Figure A-30. Notice <strong>the</strong><br />
slight overlap in <strong>the</strong> taskbars <strong>for</strong> Tasks 10 and 11 and <strong>the</strong> short gap between <strong>the</strong><br />
taskbars <strong>for</strong> Tasks 12 and 13. Also notice <strong>the</strong> changes in <strong>the</strong> Predecessors column<br />
<strong>for</strong> tasks 11, 12, and 13. Double-click <strong>the</strong> Zoom Out button to see<br />
all of <strong>the</strong> Gantt chart symbols and <strong>the</strong> main timeline in quarters. The project<br />
completion date should be 11/16.<br />
Copyright 2009 Cengage Learning. All Rights Reserved.<br />
May not be copied, scanned, or duplicated, in whole or in part.