Advice for the Project Management Professional (PMP)
Advice for the Project Management Professional (PMP)
Advice for the Project Management Professional (PMP)

You also want an ePaper? Increase the reach of your titles
YUMPU automatically turns print PDFs into web optimized ePapers that Google loves.
Licensed to:<br />
<strong>the</strong> color of <strong>the</strong> bars on <strong>the</strong> Gantt chart. Tasks on <strong>the</strong> critical path will automatically be red<br />
in <strong>the</strong> Network Diagram view, as described in <strong>the</strong> following section.<br />
To make <strong>the</strong> text <strong>for</strong> <strong>the</strong> critical path tasks appear in red in <strong>the</strong> Entry table and on <strong>the</strong><br />
Gantt chart:<br />
Select<br />
Critical<br />
Tasks<br />
Select<br />
Red<br />
1. Open <strong>the</strong> Text Styles dialog box. Click Format on <strong>the</strong> Menu bar, and <strong>the</strong>n click<br />
Text Styles. The Text Styles dialog box opens.<br />
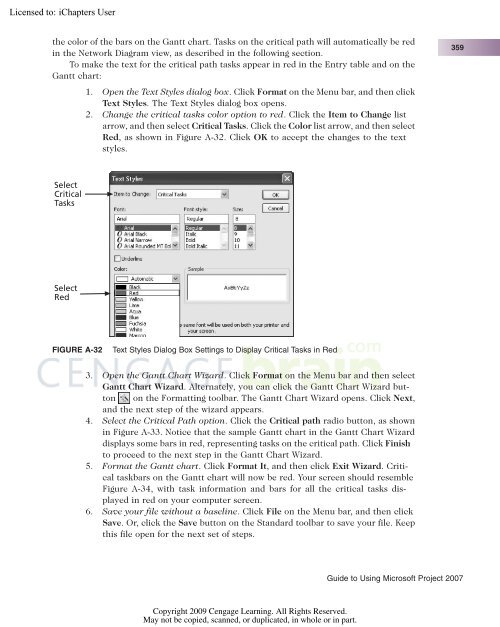
2. Change <strong>the</strong> critical tasks color option to red. Click <strong>the</strong> Item to Change list<br />
arrow, and <strong>the</strong>n select Critical Tasks. Click <strong>the</strong> Color list arrow, and <strong>the</strong>n select<br />
Red, as shown in Figure A-32. Click OK to accept <strong>the</strong> changes to <strong>the</strong> text<br />
styles.<br />
FIGURE A-32 Text Styles Dialog Box Settings to Display Critical Tasks in Red<br />
3. Open <strong>the</strong> Gantt Chart Wizard. Click Format on <strong>the</strong> Menu bar and <strong>the</strong>n select<br />
Gantt Chart Wizard. Alternately, you can click <strong>the</strong> Gantt Chart Wizard button<br />
on <strong>the</strong> Formatting toolbar. The Gantt Chart Wizard opens. Click Next,<br />
and <strong>the</strong> next step of <strong>the</strong> wizard appears.<br />
4. Select <strong>the</strong> Critical Path option. Click <strong>the</strong> Critical path radio button, as shown<br />
in Figure A-33. Notice that <strong>the</strong> sample Gantt chart in <strong>the</strong> Gantt Chart Wizard<br />
displays some bars in red, representing tasks on <strong>the</strong> critical path. Click Finish<br />
to proceed to <strong>the</strong> next step in <strong>the</strong> Gantt Chart Wizard.<br />
5. Format <strong>the</strong> Gantt chart. Click Format It, and <strong>the</strong>n click Exit Wizard. Critical<br />
taskbars on <strong>the</strong> Gantt chart will now be red. Your screen should resemble<br />
Figure A-34, with task in<strong>for</strong>mation and bars <strong>for</strong> all <strong>the</strong> critical tasks displayed<br />
in red on your computer screen.<br />
6. Save your file without a baseline. Click File on <strong>the</strong> Menu bar, and <strong>the</strong>n click<br />
Save. Or, click <strong>the</strong> Save button on <strong>the</strong> Standard toolbar to save your file. Keep<br />
this file open <strong>for</strong> <strong>the</strong> next set of steps.<br />
Copyright 2009 Cengage Learning. All Rights Reserved.<br />
May not be copied, scanned, or duplicated, in whole or in part.<br />
359<br />
Guide to Using Microsoft <strong>Project</strong> 2007